

📈📉 MATIC Trade Spotted! We Are Taking Profits on BTC!
📈📉 MATIC Trade Spotted! We Are Taking Profits on BTC!

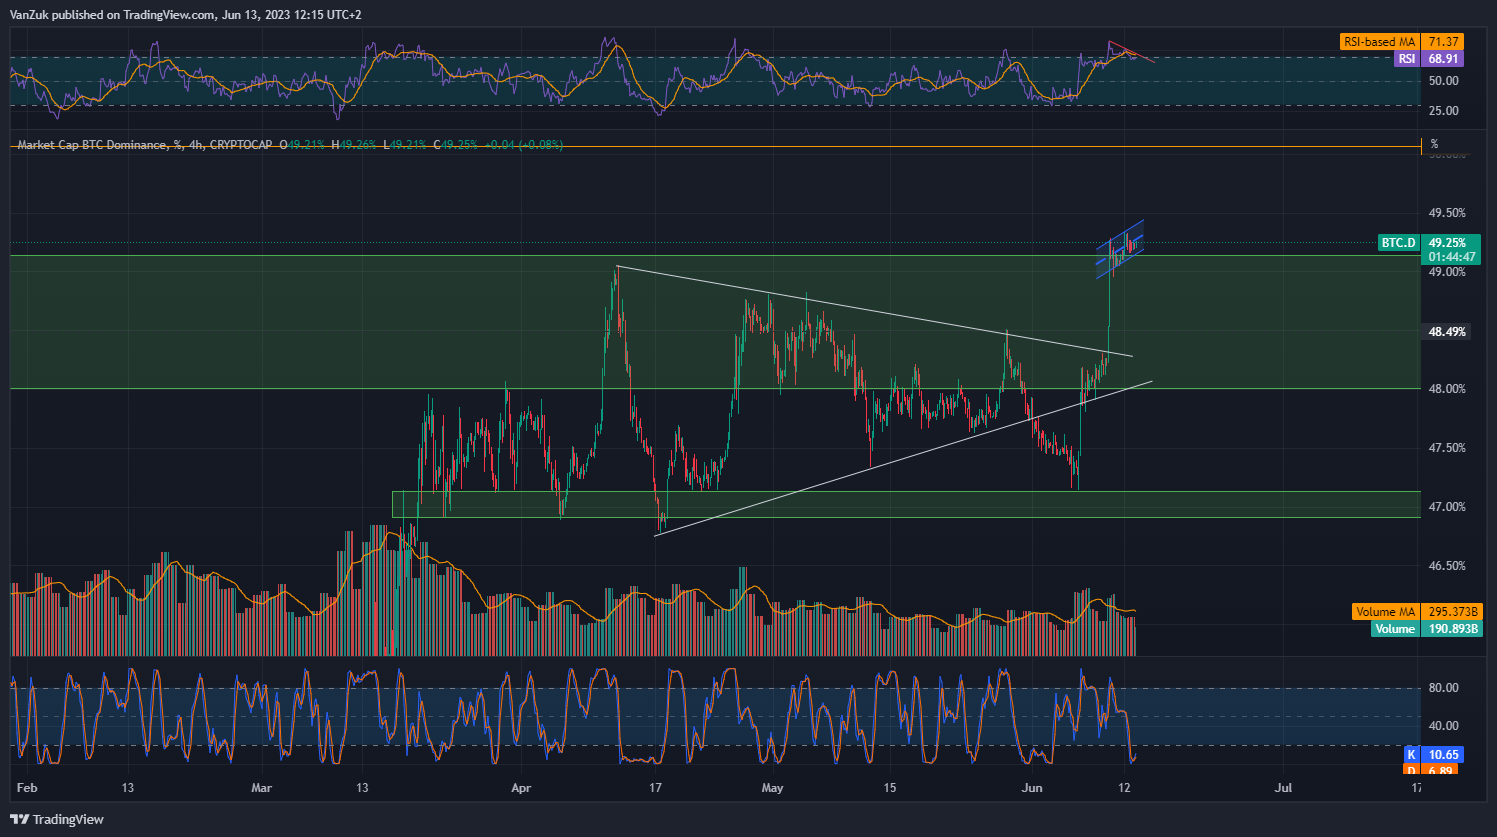
Chart #1 - Bitcoin Dominance (BTC.D) 4-Hour Chart
Chartist: Sheldon
(For the chart screenshot, click here.)
As can be seen, Bitcoin Dominance broke to the upside of the bullish wedge with the drop on Friday night.
It also broke the important 49% level. When Bitcoin Dominance rises, it is very bearish for altcoins.
We are now in a bear flag, which is highlighted in blue. This is a bearish pattern that has a 68% chance of a break to the downside.
We also have a bearish divergence on the RSI, indicating that dominance should retrace downwards.
This is bullish for altcoins, so we are considering small altcoin trades for today.
Sign-up and trade on Bybit today.
Exclusive $30,000 deposit rewards and bonuses up for grabs!
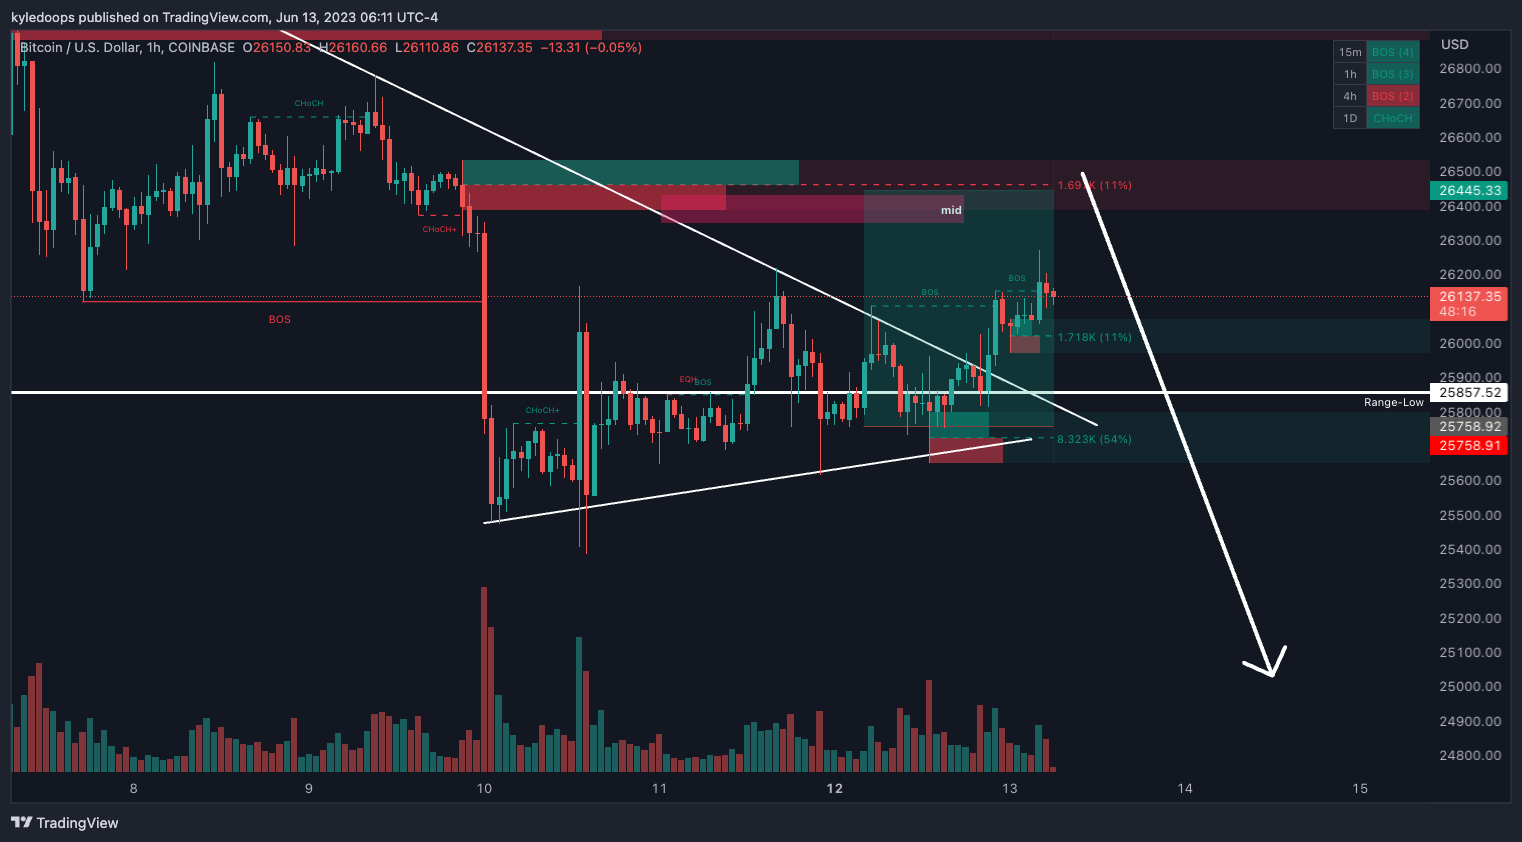
Chart #2 - Bitcoin (BTCUSD) 1-Hour Chart
Chartist: Kyle
(For the chart screenshot, click here.)
Here's an update on yesterday's long trade we took on BTC using the hourly chart.
The trade is well into profit and our final Take Profit (TP) is about to get hit, at $26,541.
We'll move our stop loss to break even and then trail it to secure partial profits.
Thereafter, we would be looking for a pullback, potentially sweeping the recent lows at $25,000.
𝗣𝗿𝗶𝗺𝗲 𝗫𝗕𝗧
Sign up for a new Trading Account on Prime XBT!
Receive a deposit bonus of up to $7,000 with promo code: KyleDoops

Sign up for a new Trading Account on Prime XBT!
Receive a deposit bonus of up to $7,000 with promo code: SheldonSniper
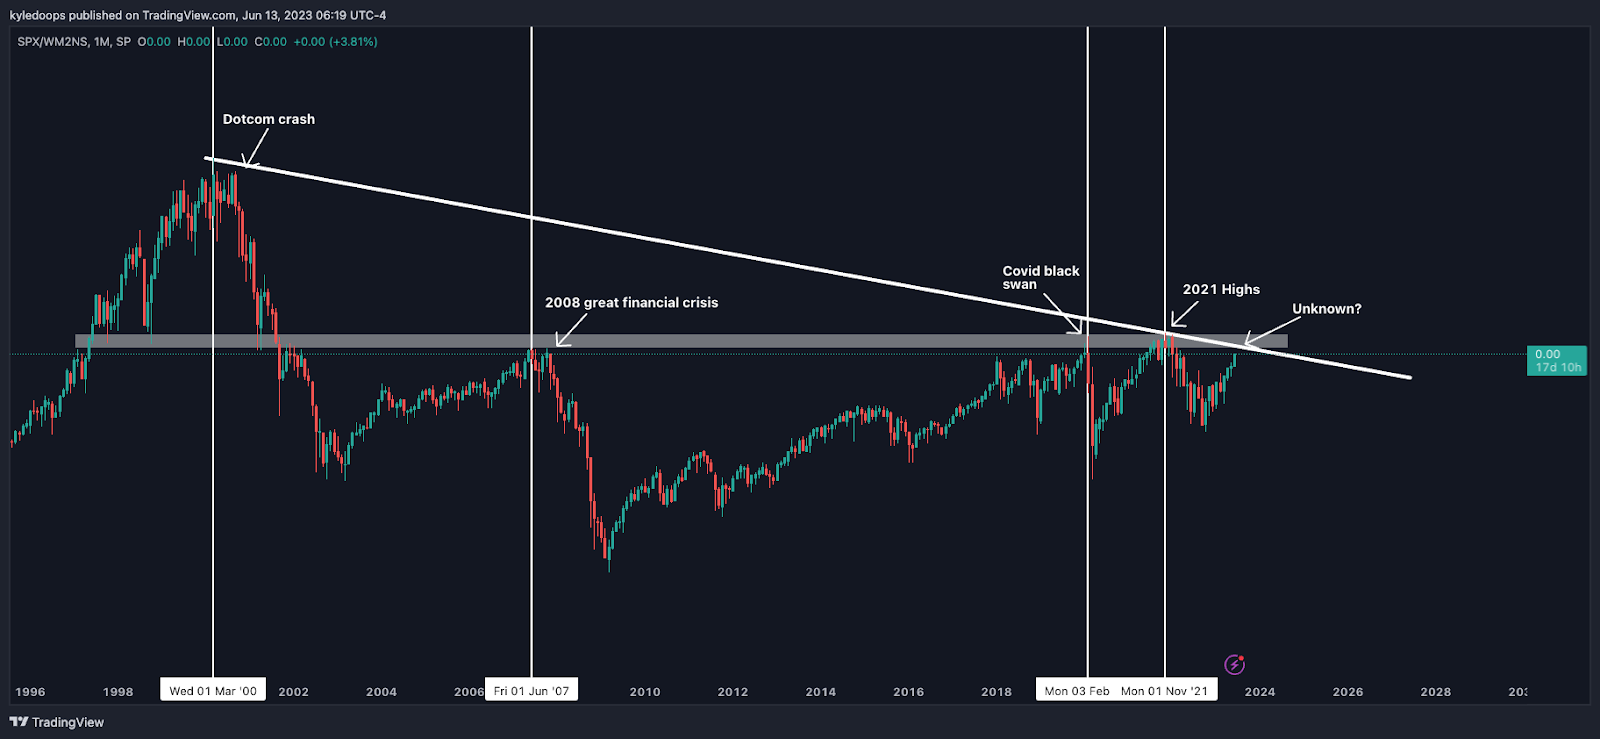
Chart #3 - S&P 500 x M2 Money Supply 1-Month Chart
Chartist: Kyle
(For the chart screenshot, click here.)
Here's the S&P 500 against the M2 money supply chart on the monthly time frame. This is an incredibly interesting chart that we're showing for the first time. There are no price levels to label, only ratios and visual depictions.
What is important to understand is that each time the diagonal trend line or horizontal resistance was hit, a major sell-off commenced. Vertical lines depict each crash with a label.
First, we see the dotcom crash, then the 2008 Great Financial Crisis, followed by the COVID-19 black swan event, then the 2021 stock market highs, and now we are coming into that level yet again.
To put this into pricing perspective, the stock market has approximately another 4-5% upside before it pushes into this strong resistance level.
Claim your Bitget sign-up bonuses here (details below).
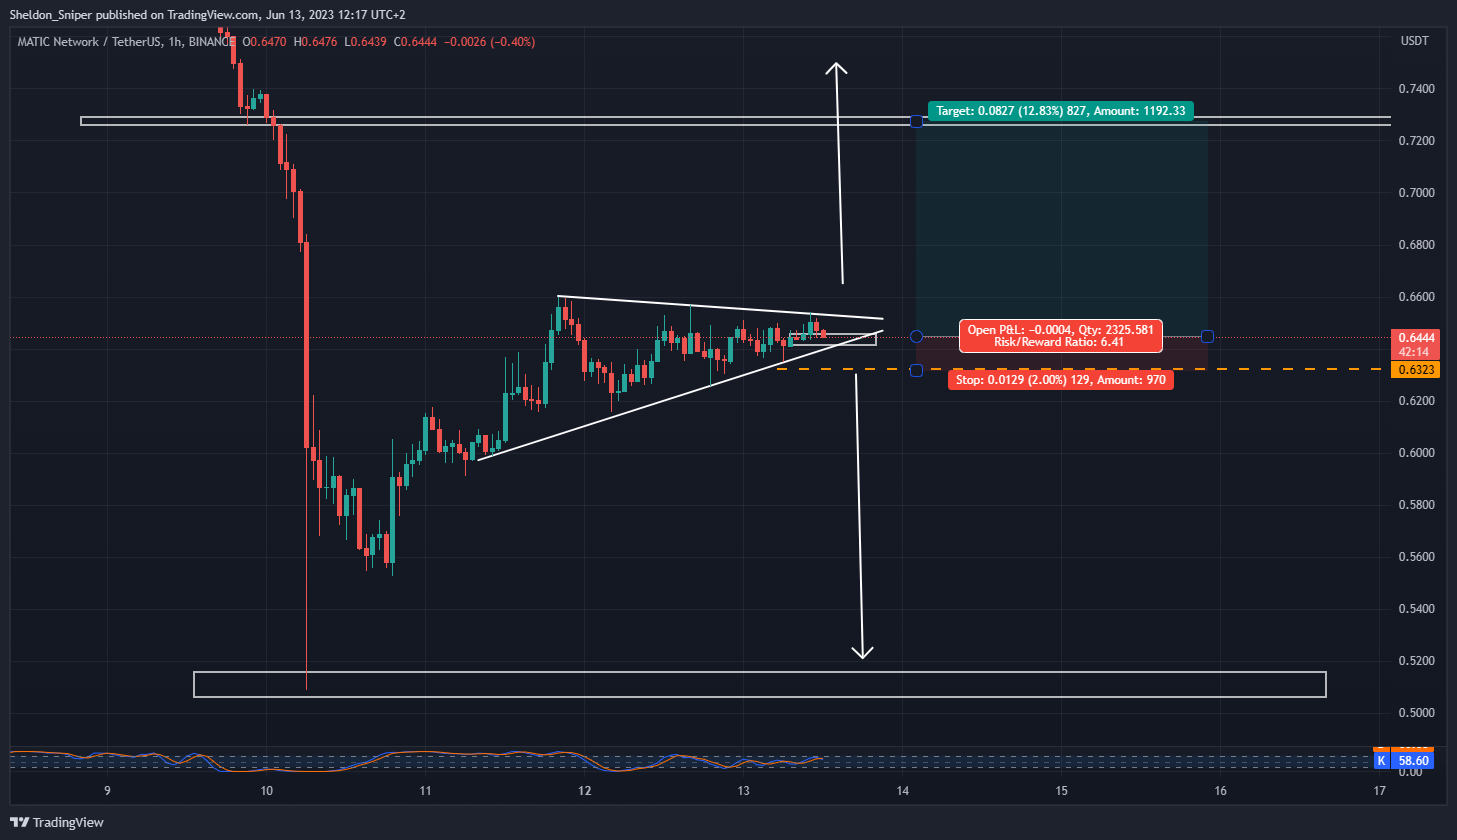
Chart #4 - Polygon (MATICUSDT) 1-Hour Chart
Chartist: Sheldon
(For the chart screenshot, click here.)
MATIC has made a significant recovery from its weekend lows, up around +30%.
It is currently in a bull flag, which statistically has a 68% chance of breaking to the upside.
We are currently in an excellent entry zone, with a stop loss set at 0.6323 and a potential target of approximately $0.72.
Claim your Bitget sign-up bonuses here (details below).
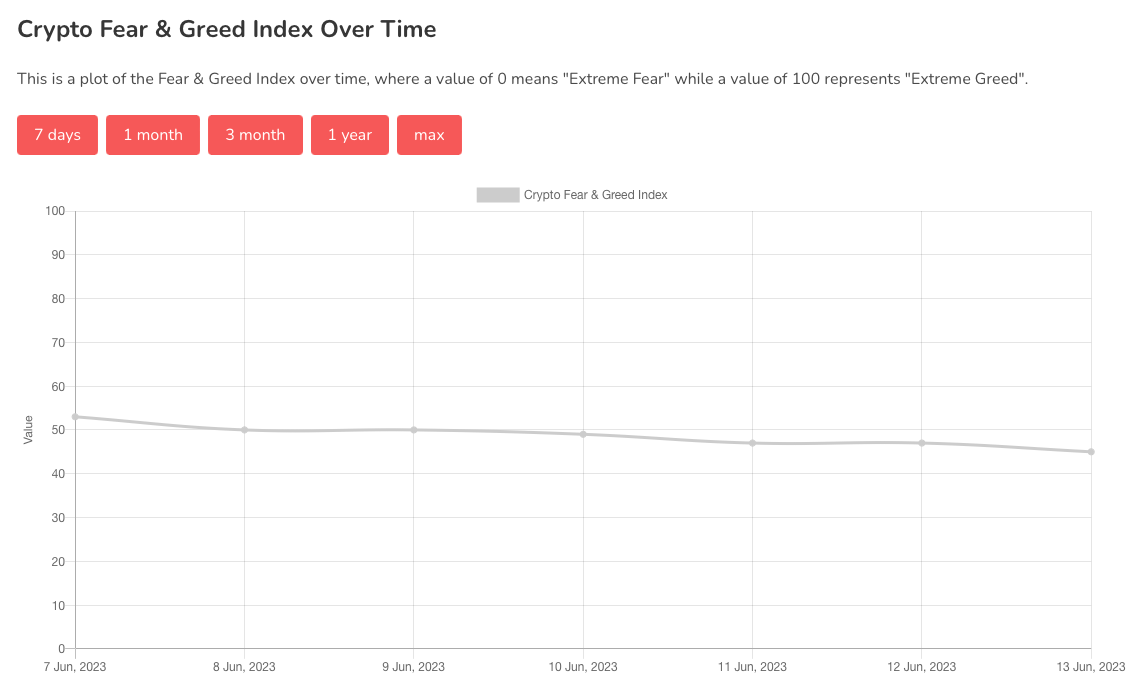
Chart #5 - Bitcoin Fear and Greed Index
The Bitcoin Fear and Greed Index is sitting at 45 today, indicating Fear.
The highest the index has been over the past seven days is 53, and the lowest is 45.
Banter’s Take
CPI is expected to come out today better than expected.
As traders it's often best to sit these major economic events out, and remain sidelined for better clarity on what to expect next. High time frame bulls still have a slight edge, but with the stock market set to pullback at any moment, the probabilities are starting to slowly shift towards the bears for the short term.
Stay safe my friends!
Go to our Crypto Banter Discord here where Sheldon and Kyle give updates on the charts and trades from The Daily Candle newsletter!