

📈📉 Microsoft Stock About to EXPLODE!
📈📉 Microsoft Stock About to EXPLODE!
PLUS: THESE are the GameFi Tokens We Are TRADING!
Overview
Chart #1 - Gala (GALAUSDT) 2-Day
Chart #2 - S&P 500 Futures (ES1!) Daily
Chart #3 - Ethereum to Bitcoin Ratio (ETHBTC) Daily
Chart #4 - The Sandbox (SANDUSDT) Daily
Chart #5 - Fear and Greed Index
Chart #1 - Gala (GALAUSDT) 2-Day
Chartist: Sheldon

(For the chart screenshot, click here.)
After seeing some notable upside in certain altcoins over the last few weeks, I believe the next set of coins may be gearing up to move.
My focus is on the Gaming Coins, particularly GALA Games.
In the past two weeks, GALA's price has been oscillating between a support of $0.02 and a resistance of $0.026. The daily descending resistance line, originating from May 2022, intersects around the same area, adding extra resistance near $0.026.
A breakthrough of both the descending resistance line and the $0.028 resistance level could lead to the next resistance zone at $0.035 - $0.038.
Currently, both the daily 200MA and the $0.02 level are providing support for GALA.
Sign-up and trade on Bybit today.
Exclusive $30,000 deposit rewards and bonuses up for grabs!
Chart #2 - Microsoft Corp (MSFT) Weekly
Chartist: Kyle
(For the chart screenshot, click here.)
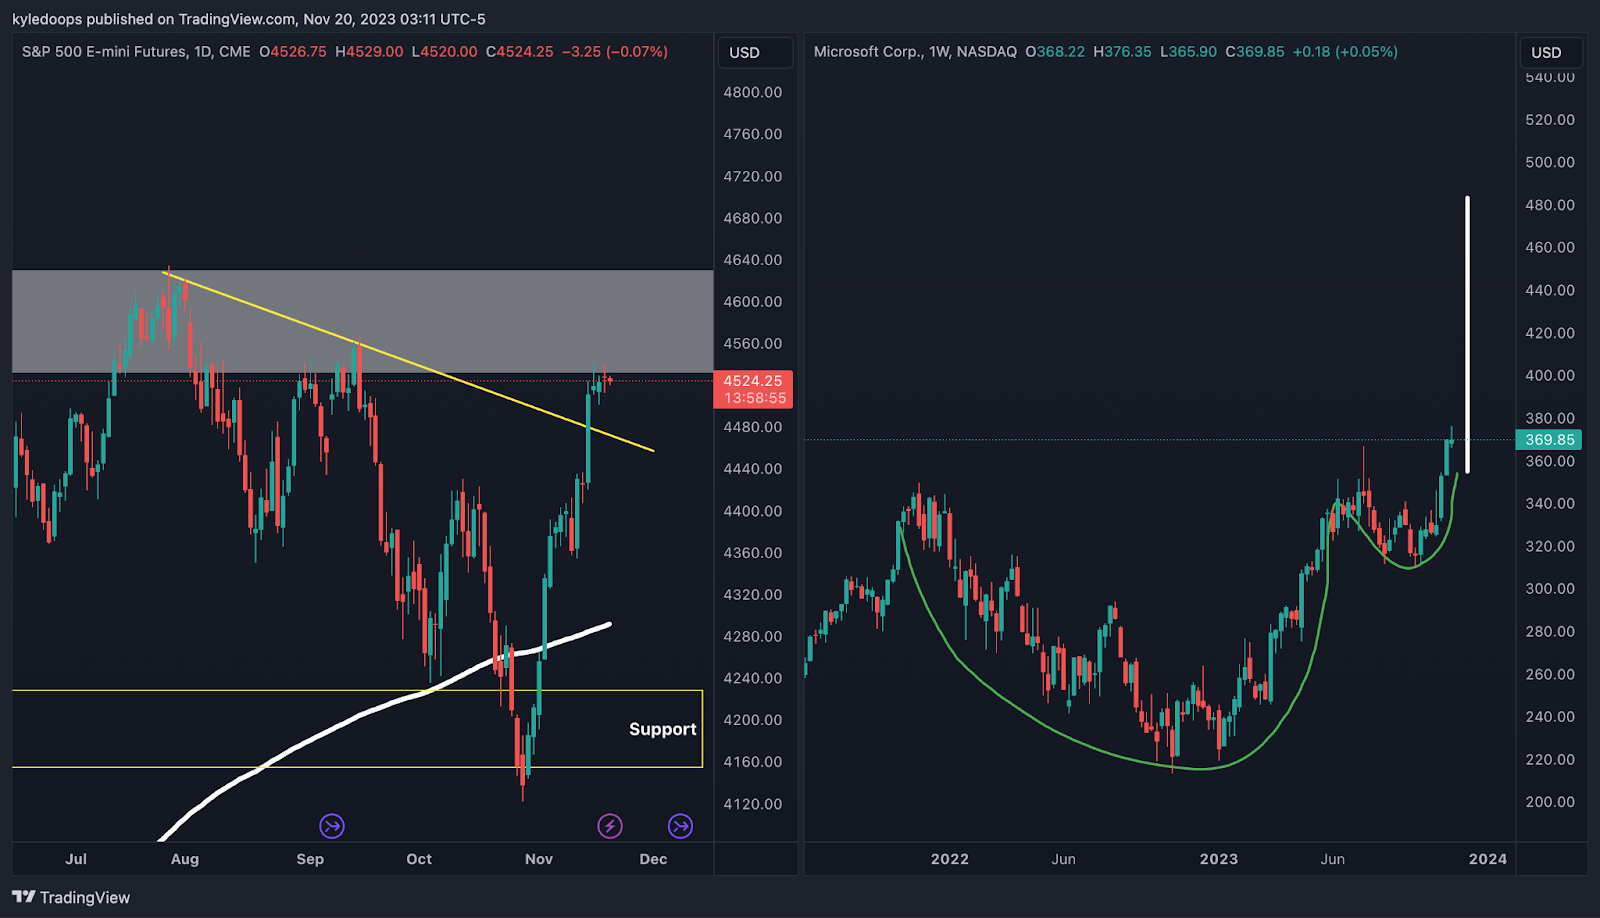
Investors are concerned about the latest saga between Microsoft and OpenAI, where Sam Altman was ousted from OpenAI.
They fear that this might lead to a collapse in Microsoft's stock, potentially dragging down the broader stock market and the crypto sector. However, as indicated by the chart, the S&P 500 is encountering key resistance, and Microsoft is in a massive cup and handle formation, on the verge of a breakout.
Therefore, the likelihood of a collapse seems unlikely.
Claim your Bitget sign-up bonuses here (details below).

Outsmart 99% Of The Market!
Get full access into our Discord And Telegram group, where you'll find all of our premium content!
👉 Trade Signals!
👉 Trade Set-Ups!
👉 Trading Challenges!
👉 Education!
👉 SO MUCH MORE!
Chart #3 - Ethereum to Bitcoin Ratio (ETHBTC) Daily
Chartist: Kyle
(For the chart screenshot, click here.)
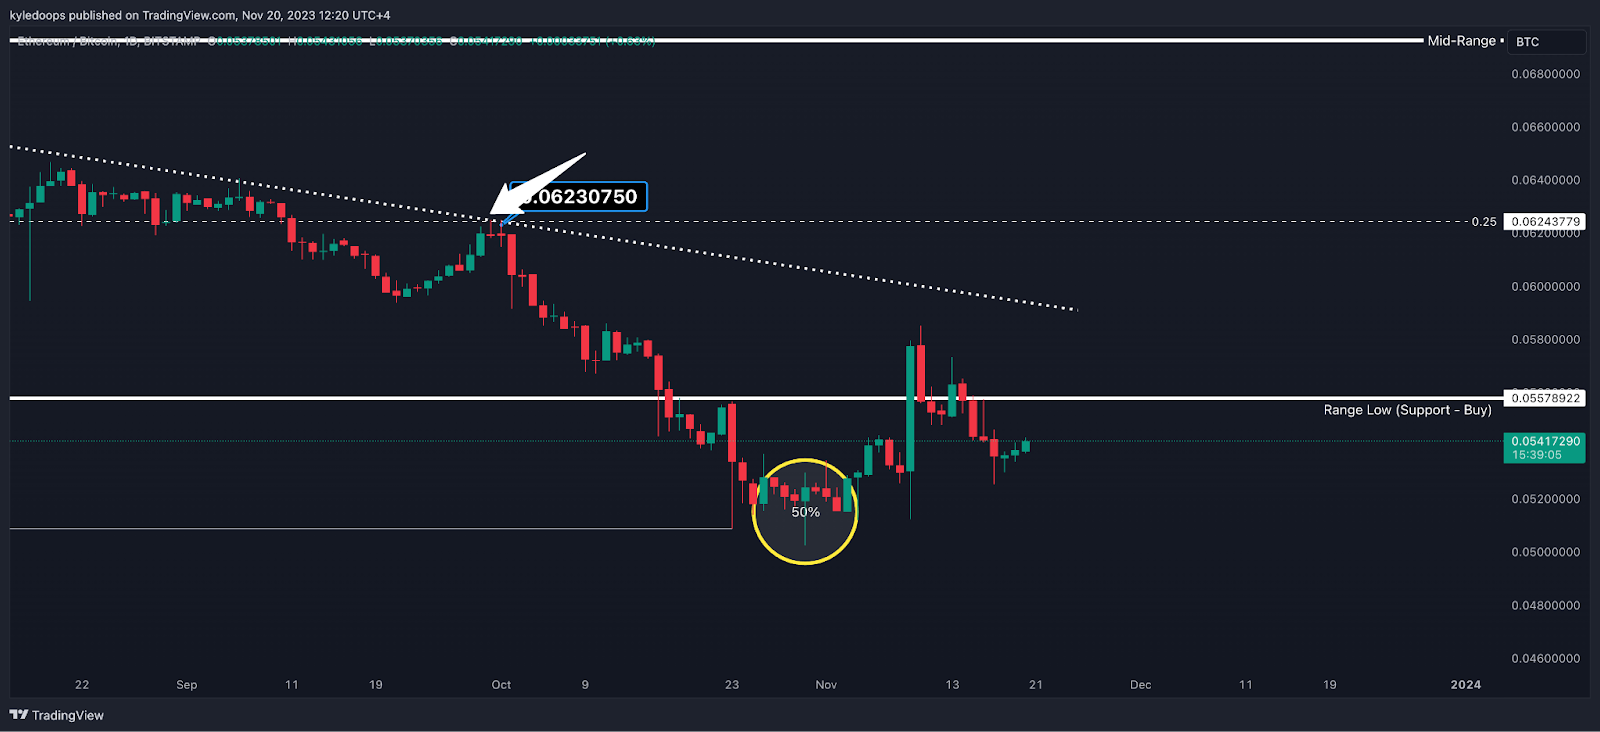
ETH/BTC is putting in higher lows on the daily and looks poised to soon reclaim the range low level.
Aggressive traders might consider bidding ETH/BTC right here at the third higher low, while conservative traders may seek an entry upon reclaiming 0.055, the range low level.
Reclaiming these levels suggests that the next target will be the dotted, down-sloping trend line.
Claim your Bitget sign-up bonuses here (details below).
Chart #4 - The Sandbox (SANDUSDT) Daily
Chartist: Sheldon
(For the chart screenshot, click here.)
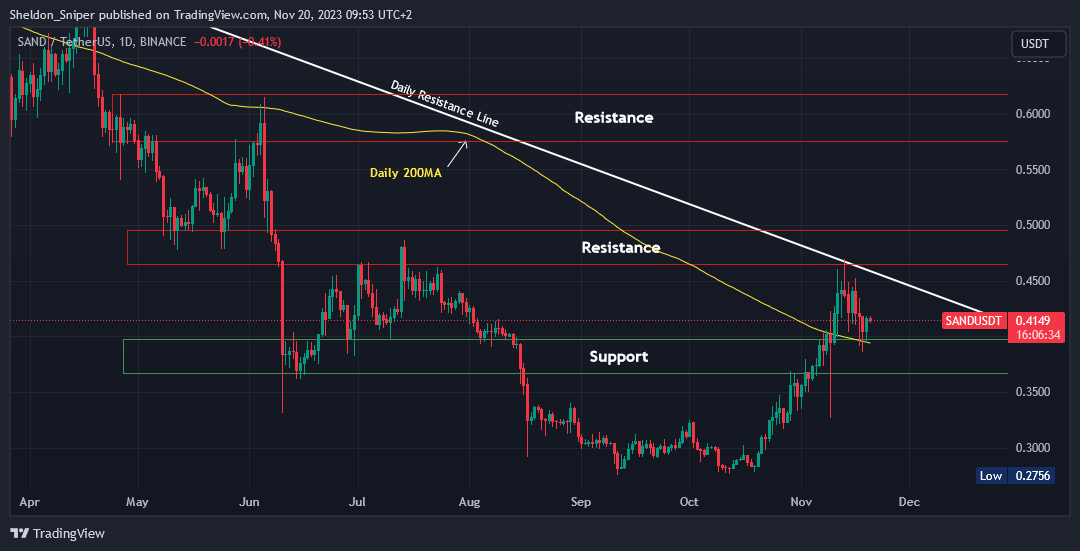
The second gaming coin I'm looking into is SAND.
Over the past two weeks, SAND has been consolidating between the daily 200MA support at $0.40 and the $0.45 - $0.465 resistance level. There’s also the daily descending resistance line around $0.45 acting as additional resistance.
If it can break through, the next target is $0.5750 - $0.62.
Claim your Bitget sign-up bonuses here (details below).
Chart #5 - Fear and Greed Index
The Fear and Greed Index is sitting at 69 today, indicating Greed.
The highest the index has been over the past seven days is 70, and the lowest is 60.

Banter’s Take
All markets seem to be continuing their uptrends and pullbacks are for buying.
Stay safe my friends!
Go to our Crypto Banter Discord here where Sheldon and Kyle give updates on the charts and trades from The Daily Candle newsletter!