

📈📉 Missed THESE +40% Gains? There's STILL Time!
📈📉 Missed THESE +40% Gains? There's STILL Time!
ALERT! FOMC Volatility Incoming!
Overview
Chart #1 - Bitcoin (BTCUSD) Daily
Chart #2 - Fantom (FTMUSDT) 4-Hour
Chart #3 - Injective (INJUSDT) Daily
Chart #4 - Avalanche (AVAX) 12-Hour
Chart #5 - Fear and Greed Index
Chart #1 - Bitcoin (BTCUSD) Daily
Chartist: Sheldon
(For the chart screenshot, click here.)
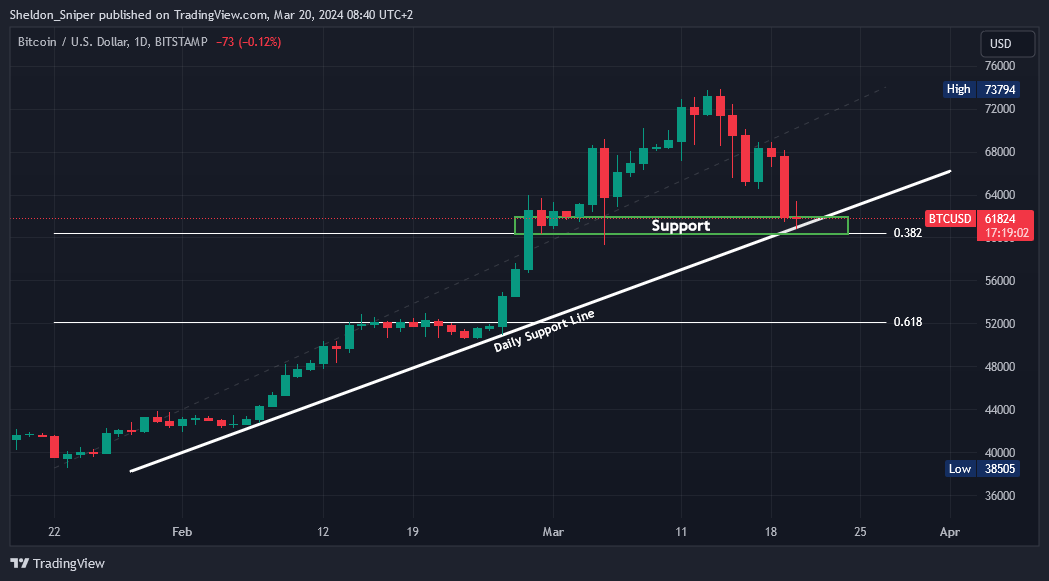
This morning BTC entered the “Golden Pocket”, now trading at a major level of support around $60,000.
The support trend line comes from the beginning of February and is on the daily timeframe. Also, this coincides with the 0.382 Fibonacci level.
The FOMC meeting is tonight, and I believe price will hang around this area over the next day or two. It therefore makes sense not to rush into trades too quickly but rather have a “ladder in” strategy for any long trades.
Be careful of price spikes down during the FOMC that could trigger and liquidate stop losses below $60,000.
Sign-up and trade on Bybit today.
Exclusive $30,000 deposit rewards and bonuses up for grabs!
Chart #2 - Fantom (FTMUSDT) 4-Hour
Chartist: Kyle

(For the chart screenshot, click here.)
Here’s an update on the FTM trade from the 12th of March.
Price entered the buy zone on the 15th of March, at $0.72, and has moved into our first Take Profit (TP) zone. Hence, it gave us 40% profits.
We’ll manually close the trade in profits if a daily close is below $0.85.
Otherwise, the next TP zones are:
TP2: $1.6
TP3: $2
Claim your Bitget sign-up bonuses here (details below).

Outsmart 99% Of The Market!
Get full access into our Discord And Telegram group, where you'll find all of our premium content!
👉 Trade Signals!
👉 Trade Set-Ups!
👉 Trading Challenges!
👉 Education!
👉 SO MUCH MORE!
Chart #3 - Injective (INJUSDT) Daily
Chartist: Kyle
(For the chart screenshot, click here.)
Long Term Trade
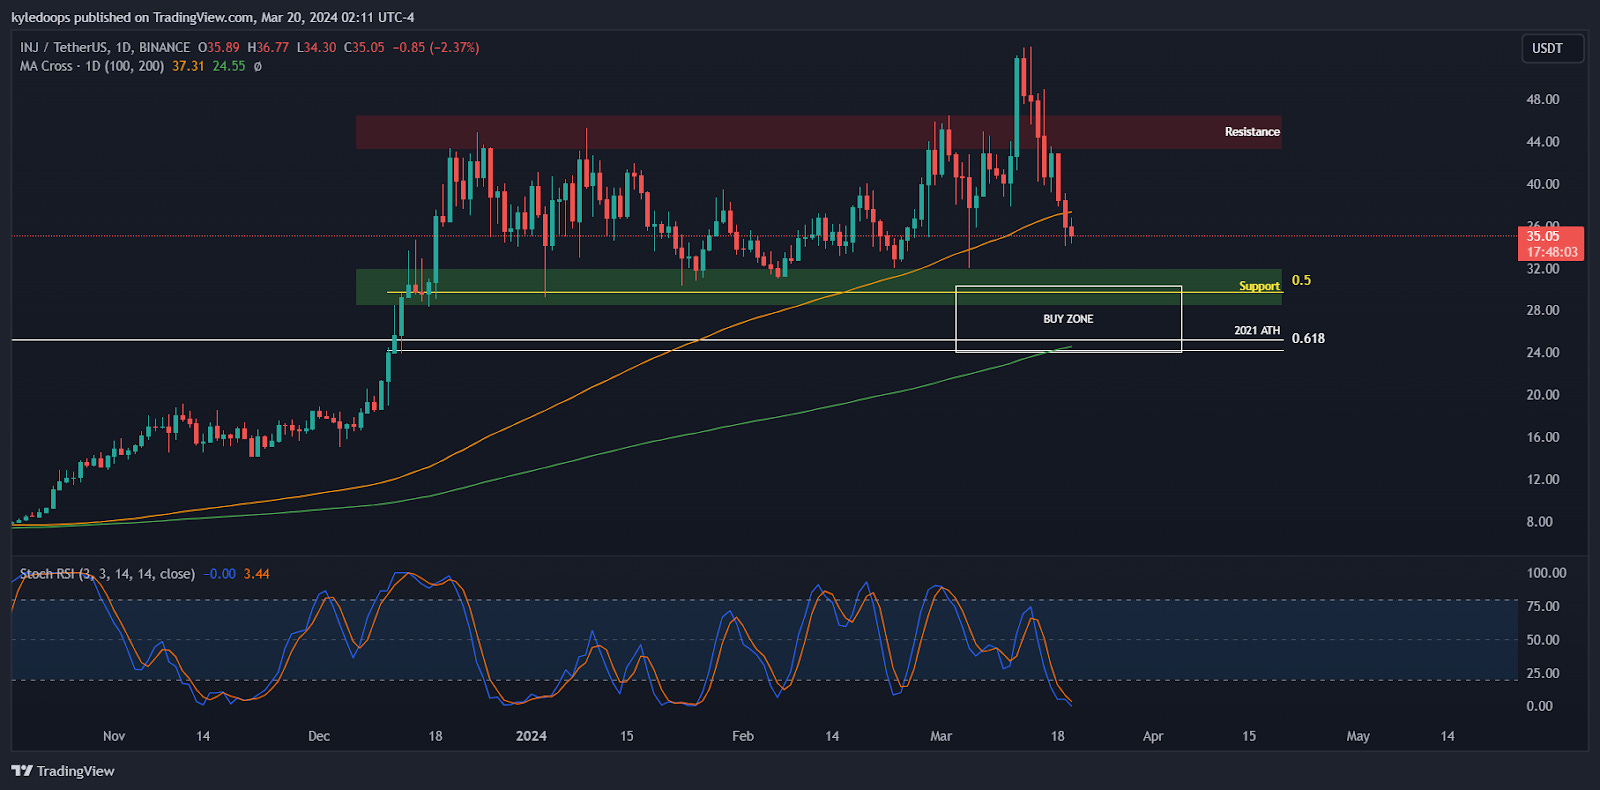
INJ had a massive move of 680% over the course of the last 5 months and is currently retracing towards its 50% level. The buy zone indicated on the chart is a major area of interest intersecting with the 200 Day Moving Average (MA), the Fib 0.618 level, and filling the FVG onto its previous ATH of $25 for a Support/Resistance (S/R) flip.
We’ll look to ladder into a long-term spot position, then add when there is a higher timeframe shift in price action towards the upside.
Buy Zone: $24 to $30
TP1: $37
TP2: $43
TP3: Price discovery
Hard Stop: Price close below $15
Claim your Bitget sign-up bonuses here (details below).
Chart #4 - Avalanche (AVAX) 12-Hour
Chartist: Sheldon
(For the chart screenshot, click here.)
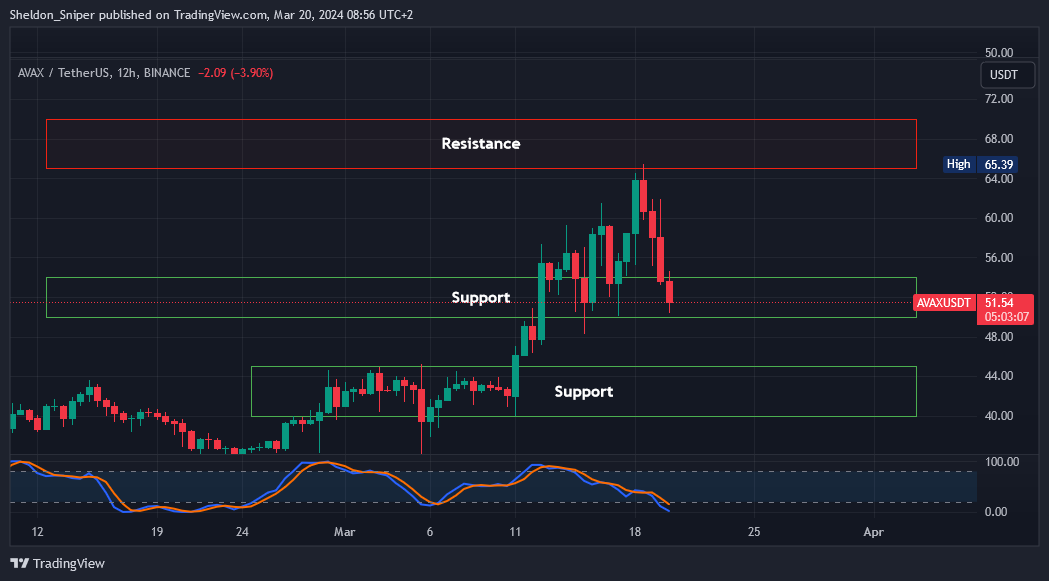
AVAX has retraced to a major area of support.
As BTC is currently also at support, this area could give us a nice chance to enter a long trade. Price could hang around this area for a day or two, so I’d rather ladder into the trade.
Entry: In the $50 - $54 area of support. Please note that the 20 Daily MA is at $48.34, which AVAX could come down to test.
TP: At the next area of resistance between $65.00 - $70.00
Stop Loss: Just Below $47.50
Claim your Bitget sign-up bonuses here (details below).
Chart #5 - Fear and Greed Index
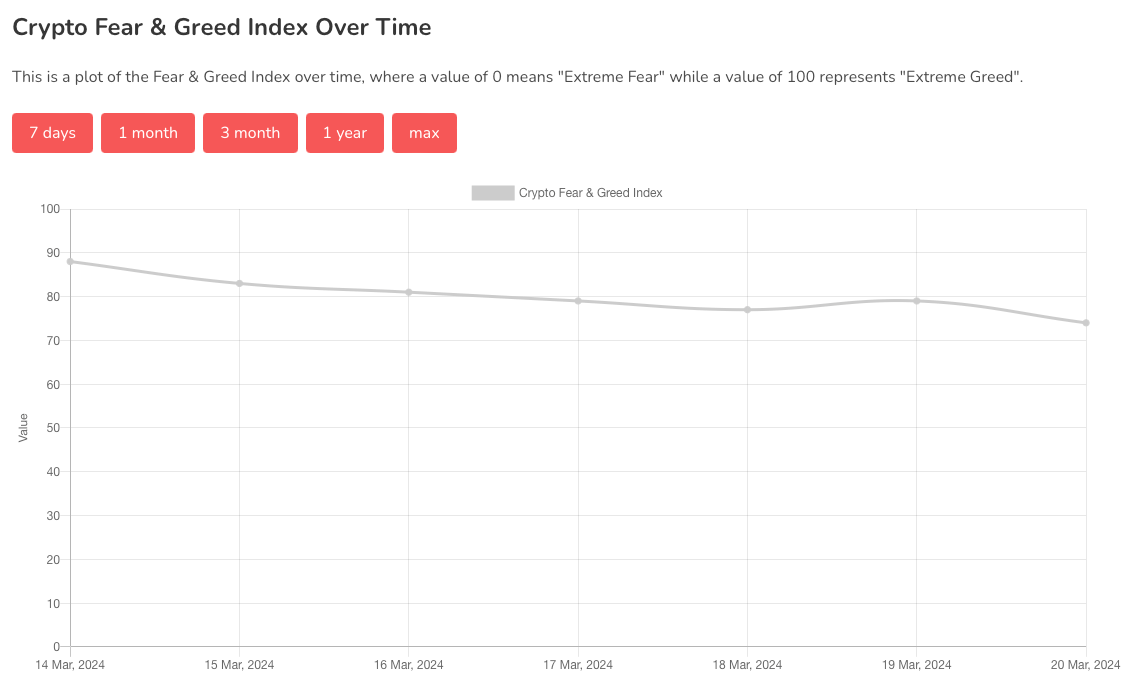
The Fear and Greed Index is sitting at 74 today, indicating Greed.
The highest the index has been over the past seven days is 88, and the lowest is 74.
Banter’s Take
BTC is still trending down with selling pressure that could bring us to lower levels.
If BTC can’t reclaim and hold above $68k today, we could get a move towards the $52k - $55k region.
The FOMC meeting is scheduled for today. The current sentiment is that the markets have already priced in a further rate cut so anything that differs from this could result in some sharp price action. We’ll keep this in mind while trading over the next 24 hours, and manage our risk accordingly.
We’ll also look for high discount zones on our favorite tokens to potentially buy the dip.
Stay safe my friends!
Go to our Crypto Banter Discord here where Sheldon and Kyle give updates on the charts and trades from The Daily Candle newsletter!