

📈📉 Most Alts to Gain +67% Soon!
📈📉 Most Alts to Gain +67% Soon!
PLUS: BTC Could Drop to THESE Levels!
Overview
Chart #1 - Theta Network (THETAUSDT) Daily
Chart #2 - USDT Market Cap (USDT) Monthly
Chart #3 - Crypto Market Cap excl. BTC and ETH (TOTAL3) Weekly
Chart #4 - Bitcoin (BTCUSDT) Daily
Chart #5 - Fear and Greed Index
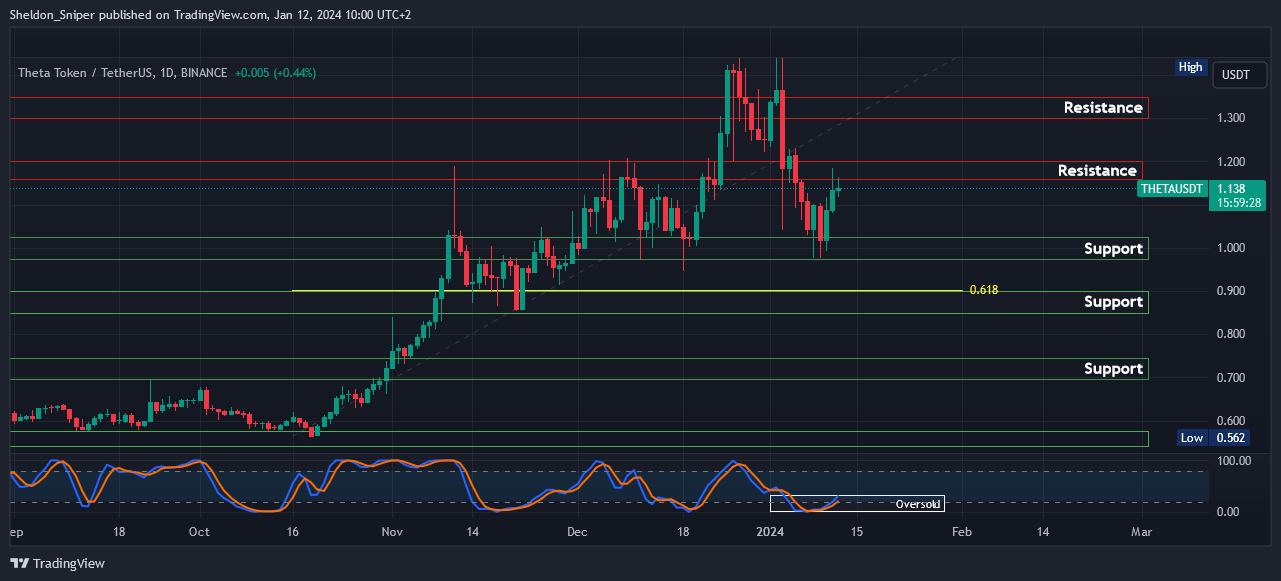
Chart #1 - Theta Network (THETAUSDT) Daily
Chartist: Sheldon
(For the chart screenshot, click here.)
Following this week's BTC spot ETF announcement, I anticipate that over the next few weeks, cash will start shifting from BTC into the alts.
I’m considering a long trade on THETA.
The price was rejected at $1.45 three weeks ago and has been retracing since. Now within the $1.15 - $1.20 area of resistance, if it gets rejected further downside to test the next support at $0.975 - $1.025, or possibly the support after that at $0.85 - $0.90, could occur.
It's worth noting that the 0.618 Fibonacci level between the low in mid-October and last month's high is also at $0.90.
That’s the area where buyers might step in to initiate long trades.
Sign-up and trade on Bybit today.
Exclusive $30,000 deposit rewards and bonuses up for grabs!
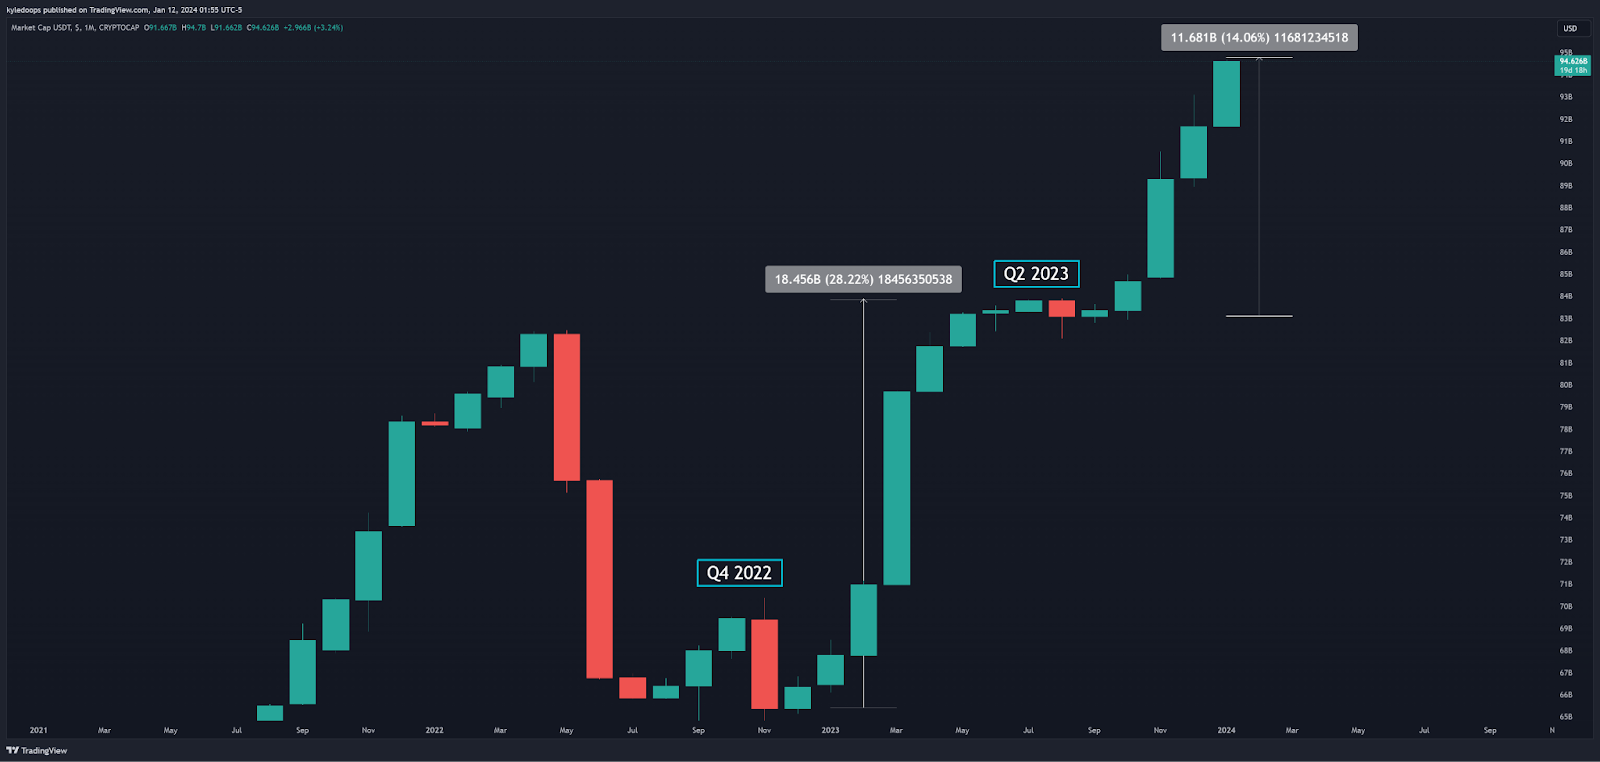
Chart #2 - USDT Market Cap (USDT) Monthly
Chartist: Kyle
(For the chart screenshot, click here.)
In the first 6 months of 2023, Tether's market cap increased significantly by $18.5B, marking a 28% growth, and then saw a pause between June and September. Since October, it has risen by another $11.7B, an increase of 14%, reaching an All-Time High of $95B.
However, during the same period, its dominance dropped by 36%, which shows that there is a constant influx of new investments in the crypto space.
Tether is gaining strength among the stablecoins, and with the recent approval of the 11 Bitcoin spot ETFs in the US, there's a clear signal for new investors to enter the space.
This influx of investors could lead to a future where crypto becomes more stable and less volatile as its capitalization increases.
Claim your Bitget sign-up bonuses here (details below).

Outsmart 99% Of The Market!
Get full access into our Discord And Telegram group, where you'll find all of our premium content!
👉 Trade Signals!
👉 Trade Set-Ups!
👉 Trading Challenges!
👉 Education!
👉 SO MUCH MORE!
Chart #3 - Crypto Market Cap excl. BTC and ETH (TOTAL3) Weekly
Chartist: Kyle

(For the chart screenshot, click here.)
Our community is important to us, and we care, so we're sharing this chart early.
Bulls have pushed altcoins out of their range and are holding above. The next resistance level is around 67% away, at approximately $760B - it seems alts are just starting to heat up. They are expected to print new All-Time Highs by the end of this bull run, potentially breaking the $1.3T mark.
Claim your Bitget sign-up bonuses here (details below).
Chart #4 - Bitcoin (BTCUSDT) Daily
Chartist: Sheldon

(For the chart screenshot, click here.)
Yesterday, Bitcoin got rejected at $48,000 and is currently trading at $45,800.
It has experienced a significant run leading up to this week’s ETF announcement, is currently overbought, and the wicks to the upside on the last few daily candles show that sellers are stepping in.
I believe a correction is coming to test lower levels of support in the next week. Possible levels are at $44,700, $40,600, and $38,250.
Claim your Bitget sign-up bonuses here (details below).
Chart #5 - Fear and Greed Index
The Fear and Greed Index is sitting at 71 today, indicating Greed.
The highest the index has been over the past seven days is 76, and the lowest is 70.
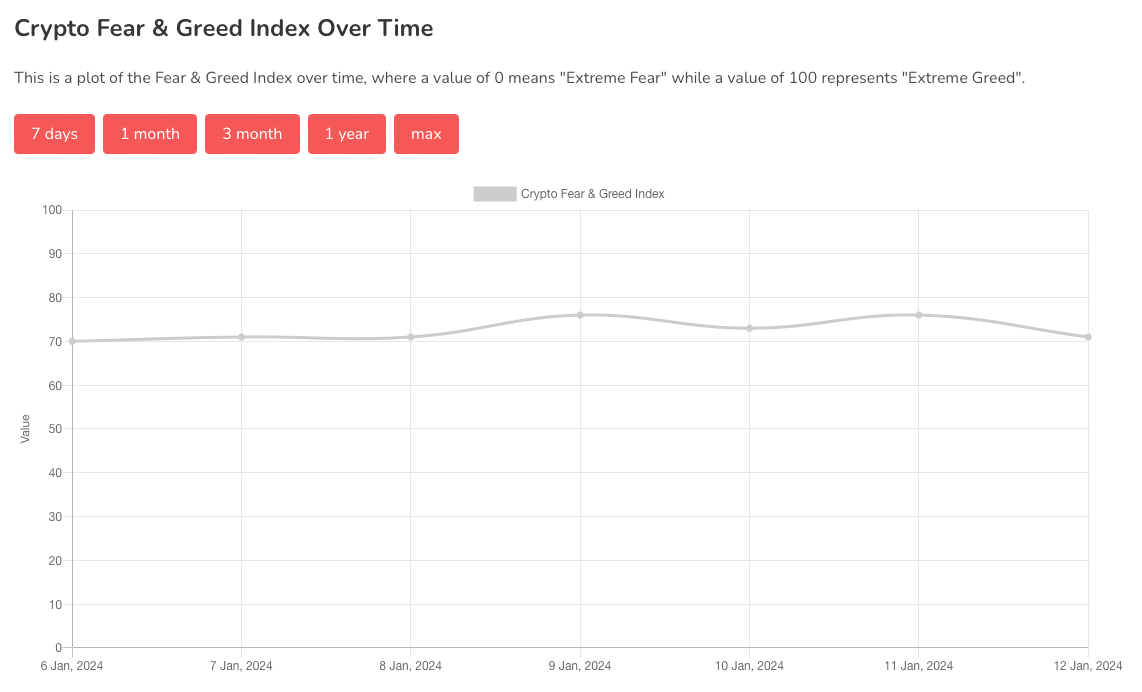
Banter’s Take
With Bitcoin's price currently near $46,000, the Fear & Greed Index at 71, coupled with the lack of a major push following the ETF news, we might see consolidation and a potential break down soon.
Ethereum is still driven by bullish momentum, as are the alts. Remember, when Bitcoin pauses, the rest of the market tends to move!
Stay safe my friends!
Go to our Crypto Banter Discord here where Sheldon and Kyle give updates on the charts and trades from The Daily Candle newsletter!