Hey Chart Hackers,
We’ve seen Bitcoin clear its daily resistance and retest key support bands, while Ethereum continues to build momentum across its ecosystem. We’re looking for high-probability retracements and range plays in the broader altcoin market!
Let’s dive in!
Overview
Chart #1 - Bitcoin
Chart #2 - Ethereum Classic (ETCUSDT) 2-Hour
Chart #3 - Grass (GRASSUSDT) 4-Hour
Chart #4 - Chainlink (LINKUSDT) 1-Hour
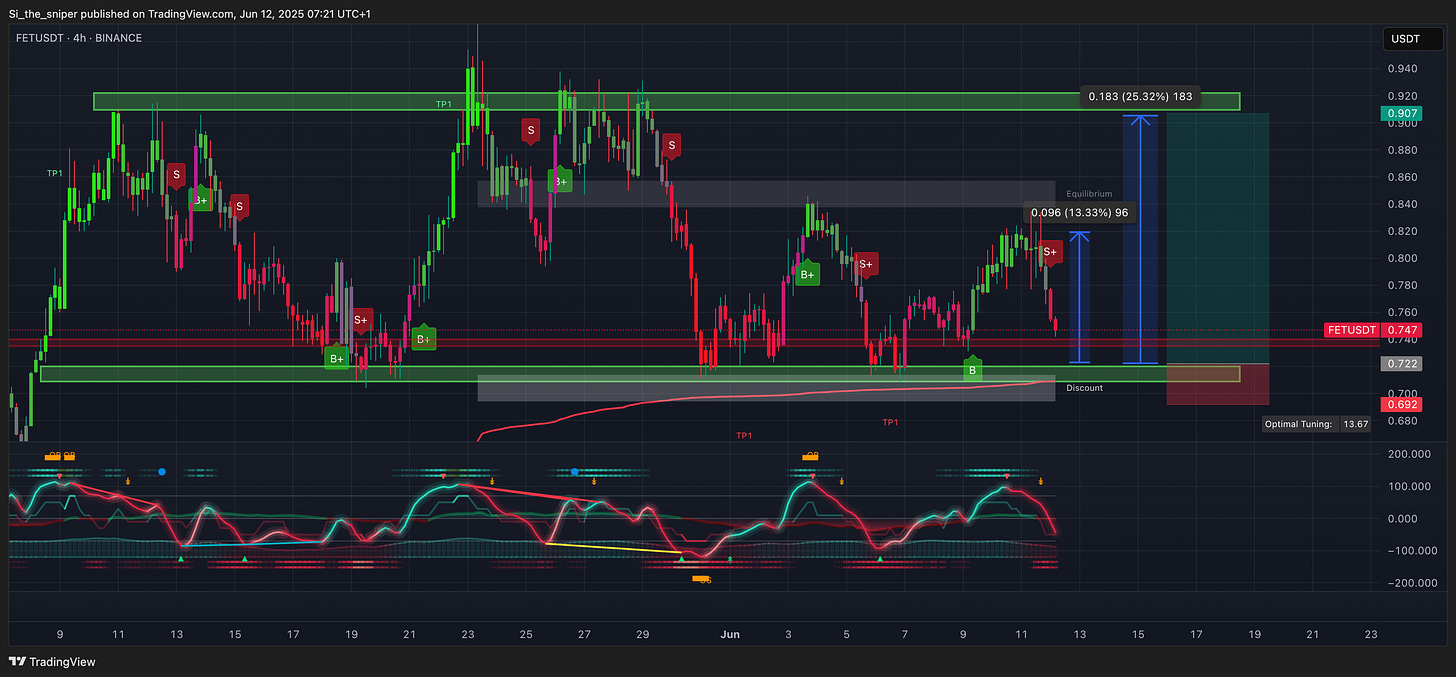
Chart #5 - Artificial Superintelligence Alliance (FETUSDT) 4-Hour
Chart #6 - Eli Lilly and Company (LLY) 1-Week
Chart #1 - Bitcoin
(BTCUSD) 1-Day
Chartist: Dylan
(For the chart screenshot, click here.)
A fair amount of bullish news this week has pushed BTC through its previous daily resistance. The question now is whether the bulls will step in and buy the support retest in the $106,000–$107,000 region. The three main bounce zones to watch for BTC this week are highlighted in yellow on the chart.
(BTCUSDT) 2-Hour
(For the chart screenshot, click here.)
On the lower timeframes, we can see BTC retesting the key daily support band, which aligns with confluence on intraday charts. With the 2-hour oscillator nearing a reversal, the risk–reward starts favoring longs in the $106,000–$107,000 region, with a stop risk of 1.5–2.5%.
Short term long idea:
Entry: $106,000-$107,000
Take Profit (TP):
TP1: $110,000
TP2: $112,000
Stop Loss:
Option 1: Close under $105,000
Option 2: Close under $103,800
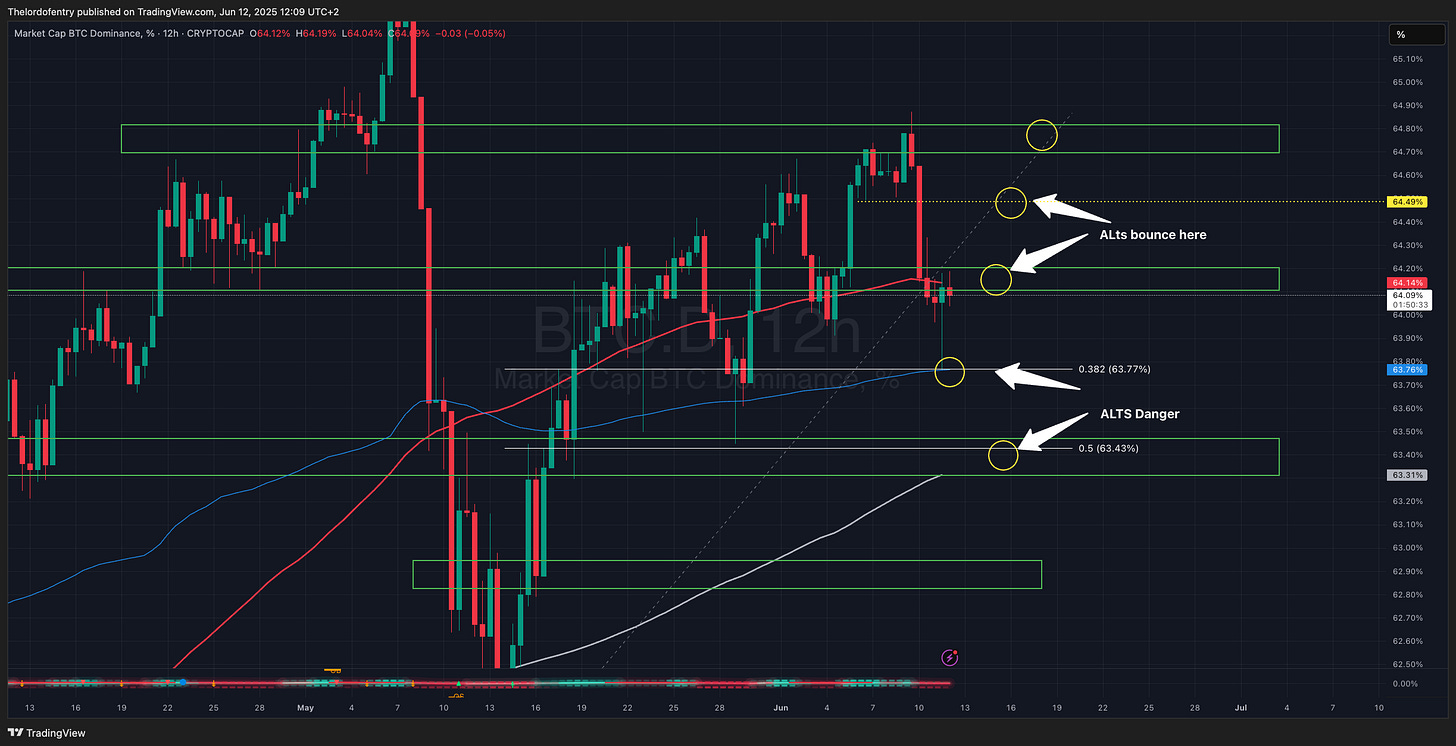
Bitcoin Dominance (BTC.D) 12-Hour
(For the chart screenshot, click here.)
Respecting basic TA and guiding us through the moves, yesterday we saw BTC.D move into the alts danger zone, and the subsequent bounce demonstrated that taking profits on longs and opening a few hedge shorts - both on the show and in Chart Hackers - was the correct move.
Limited Time Offer: Get 2 Weeks Free Access!
Get more exclusive trades from Dylan and his team by joining Chart Hackers with a 2-week free trial today! 👇
Join now to:
Access exclusive automated trading bots and indicators.
Join a private trading community on Discord & Telegram.
Learn expert entry and exit strategies from top traders.
Get real-time insights and high-level trade ideas.
Suitable for both beginners and advanced traders.
Chart #2 - Ethereum Classic (ETCUSDT) 2-Hour
Chartist: Dylan’s Chart Hackers Team
(For the chart screenshot, click here.)
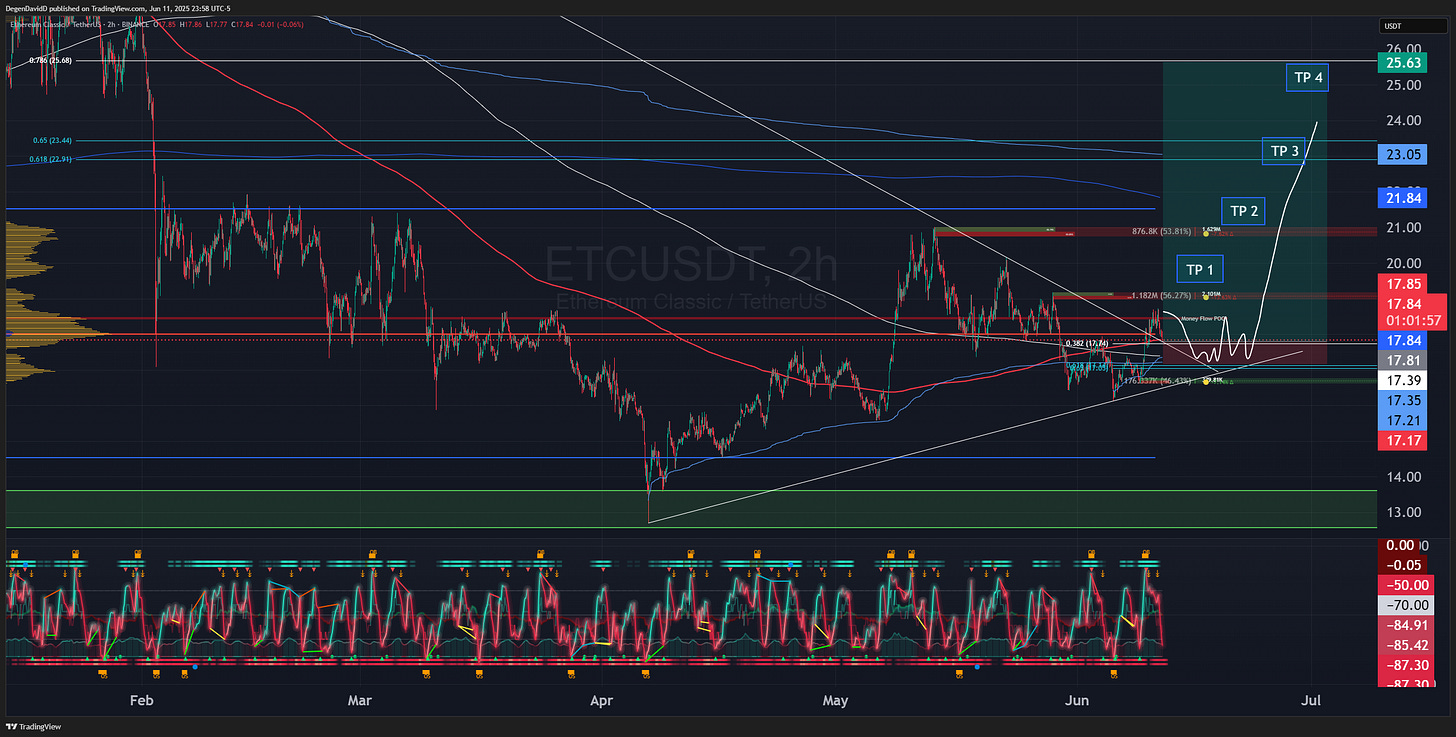
ETH is gaining momentum, driving a rally across its ecosystem (e.g., OP, ETHFI, ENS, ARB). ETC, a legacy coin, typically surges when the ETH narrative strengthens. Historically, retail and institutional investors have pushed ETC into the $30-$40 range. While tokens like ENS and ETHFI have already reached their 200-day moving averages, ETC has not.
Recently, ETC broke its higher-timeframe (HTF) trend and is holding above the anchored volume-weighted average price (AVWAP) from recent lows, forming a rising trend. It is currently retesting the point of control (POC) and the 50-day moving average, with the 100-day moving average providing additional support below. I’m targeting a move to the value area high (VAH) and the 200-day moving average, with potential for higher levels.
Entry: $16.75-$18.10
Take Profit (TP):
TP1: $20
TP2: $22
TP3: $23.20
Stop Loss: $16.05 (4-Hour candle close below)
Get more exclusive trades from Dylan and his team by joining Chart Hackers with a 2-week free trial today! 👇
Chart #3 - Grass (GRASSUSDT) 4-Hour
Chartist: Dylan’s Chart Hackers Team
(For the chart screenshot, click here.)
Assuming the market remains bullish and this is a standard late long-flush by BTC/BTC.D, GRASS is currently holding at a confluence of a Fibonacci level, a rising trendline, and a bullish order block.
Entry: ~$1.7325
Take Profit (TP):
TP1: $1.82
TP2: $1.897
TP3 : $1.985
Stop Loss: $1.664 (4-Hour candle close below)
Leverage: 5x and increase after TP1 area is claimed.
Get more exclusive trades from Dylan and his team by joining Chart Hackers with a 2-week free trial today! 👇
Chart #4 - Chainlink (LINKUSDT) 1-Hour
Chartist: Dylan’s Chart Hackers Team
(For the chart screenshot, click here.)
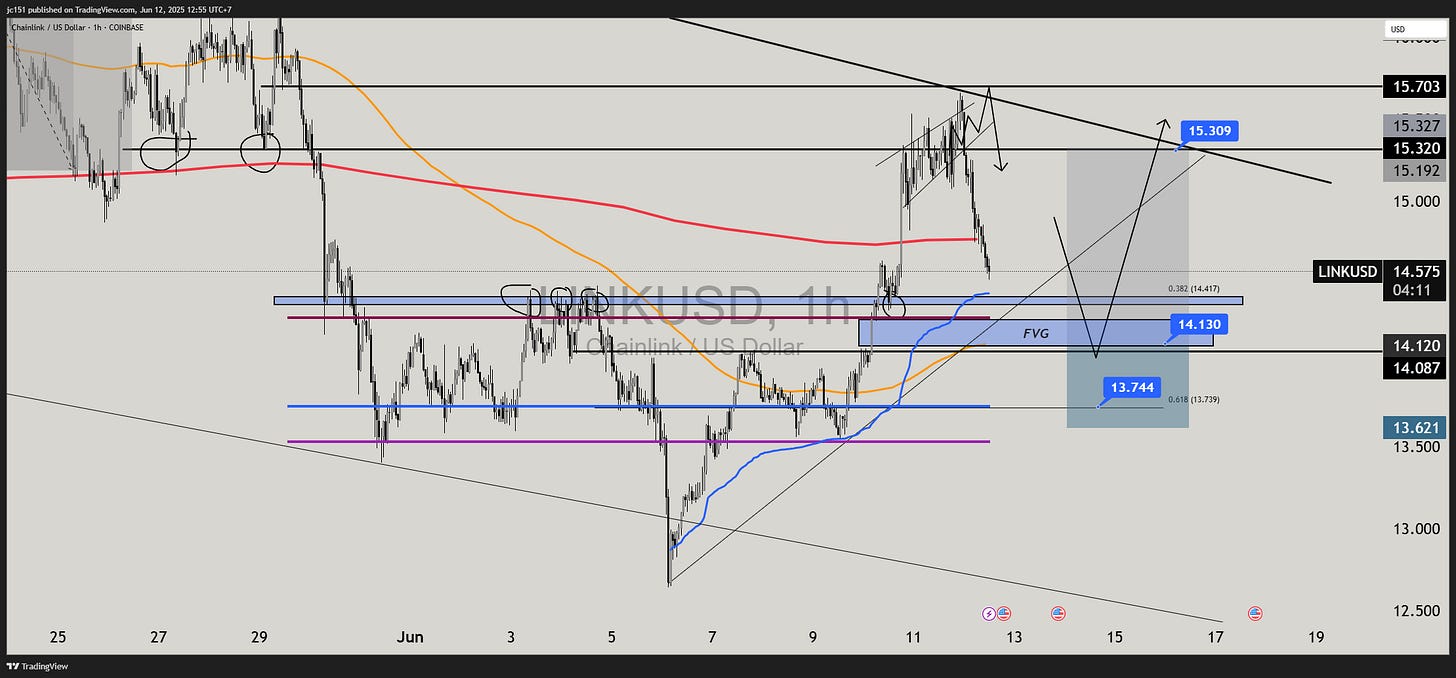
LINK is pulling back after a strong rejection at the $15.30 resistance zone and is now approaching a key support area. The price is entering a Fair Value Gap (FVG) aligned with the 0.382–0.618 Fibonacci retracement of the recent move. This zone also intersects with the prior breakout structure and the 200-period EMA, making it a high-probability bounce region.
This is a simple bullish retracement play: if the price fills the FVG and holds above the structure, we expect a rebound toward $15.30, with the potential to sweep previous highs. Market structure remains bullish unless price closes below $13.60.
Entry: $14.13–$13.74
Take Profit (TP):
TP1: $15.30
TP2: $15.70
Stop Loss: $13.60
Get more exclusive trades from Dylan and his team by joining Chart Hackers with a 2-week free trial today! 👇
Chart #5 - Artificial Superintelligence Alliance (FETUSDT) 4-Hour
Chartist: Dylan’s Chart Hackers Team
(For the chart screenshot, click here.)
The entry here is determined by the confluence of a bullish order block, a discount zone, and a solid range play, with the stop loss placed below the discount zone—safely distanced from recent wicks. Take profits are based on two order-block regions above, forming clear clusters, with TP2 at the range top. I’ll look for confirmation from the RSI bottoming and turning up, alongside improving cash flow. For the MACD, we’ll wait for clear reversal signals. In price action, we want to see bullish engulfing candles and a green buy signal before entry.
Entry: $0.718
Take Profit (TP):
TP1: $0.82
TP2: $0.91
Stop Loss: $0.69 (candle close below) - roughly 4% (ideal for spot or low-leverage long)
This setup offers approximately a 6:1 reward-to-risk ratio if TP2 is reached.
Get more exclusive trades from Dylan and his team by joining Chart Hackers with a 2-week free trial today! 👇
Chart #6 - Eli Lilly and Company (LLY) 1-Week
Chartist: Dylan
(For the chart screenshot, click here.)
I’m bullish on select medical/pharma plays. A double bullish divergence on the weekly chart, combined with a break above the 50-day MA, makes this stock look very promising. I’m buying in the yellow zone on the chart and will add to my position once it breaks above the 200-day MA.
Entry: $775-$800 then add once it breaks $830
Take Profit (TP):
TP1: $890
TP2: $930
TP3: $960
Stop Loss: $760 (close below)
Get more exclusive trades from Dylan and his team by joining Chart Hackers with a 2-week free trial today! 👇

