Hey Chart Hackers!
My team and I have selected four of our favorite altcoin trades to share with you today. Additionally, I’ve analyzed the Bitcoin chart and evaluated a traditional stock, Tesla, deciding to go short on it.
Let’s take a look!
Overview
Chart #1 - Solana (SOLUSDT) 12-Hour
Chart #2 - Ondo (ONDOUSDT) 12-Hour
Chart #3 - Bitcoin (BTCUSD) 1-Day
Chart #4 - Goatseus Maximus (GOATUSDT) 1-Hour
Chart #5 - Bubblemaps (BMTUSDT) 8-Hour
Chart #6 - Tesla, Inc. (TSLA) 12-Hour
Chart #1 - Solana (SOLUSDT) 12-Hour
Chartist: Dylan
(For the chart screenshot, click here.)
SOL 12hr Breakout Long Idea
SOL has printed a bullish reversal on the 12-hour chart and is putting pressure on the major 200-day MA resistance. A break here could be bullish for SOL, and we might see traders step in to pump this to $220.
Once it breaks the 200-day MA ($180-$182), we can look to start building a long position using either the 200-day MA as our exit plan (loss and close below) or the rising trend (loss and close below).
Entry: Break of 200-day MA, start buying small size; retest of this region, add to position ($180-$182 zone)
Take Profit (TP): $199 and $219
Stop Loss: Close below the 200-day MA ($180) OR close below the rising trend ($170)
Trade it on Blofin and earn rewards here.
Limited Time Offer: Get 2 Weeks Free Access!
Get more exclusive trades from Dylan and his team by joining Chart Hackers with a 2-week free trial today! 👇
Join now to:
Access exclusive automated trading bots and indicators.
Join a private trading community on Discord & Telegram.
Learn expert entry and exit strategies from top traders.
Get real-time insights and high-level trade ideas.
Suitable for both beginners and advanced traders.
Chart #2 - Ondo (ONDOUSDT) 12-Hour
Chartist: Dylan
(For the chart screenshot, click here.)
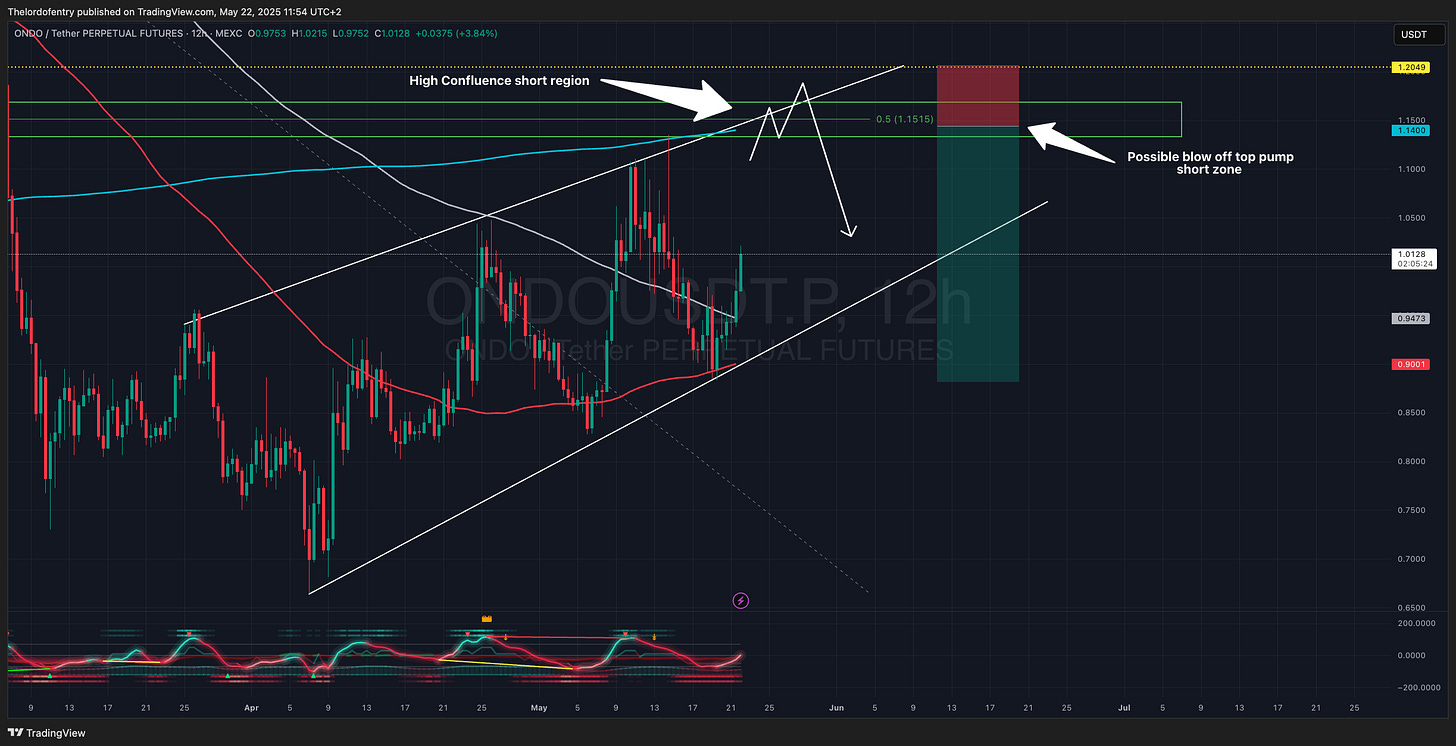
ONDO Swing Short Idea
Market looking super bullish currently, but there are still key zones to watch for major swing setups, and my eyes are on ONDO into the big zone shown on the chart. This will need to be tied in with oscillator divergences on various time frames, so make sure you are either in Chart Hackers for when I take the trade or watching the show on Banter Plus regularly for updates on my trade.
Current plan to be confirmed is:
Entry: $1.135 to $1.19
Take Profit (TP):
TP1: $1.05
TP2: $1.00
TP3: $0.90
Stop Loss: Close above $1.20
Trade it on Blofin and earn rewards here.
Get more exclusive trades from Dylan and his team by joining Chart Hackers with a 2-week free trial today! 👇
🔥 Get Up to $4,000 in Free Futures Trading Bonuses
Join Blofin now and score BIG rewards just for Crypto Banter fans!
💰 Deposit and trade to earn up to 20% of your deposit amount PLUS get up to $4,000 in free futures trading bonuses!
⏰ Hurry! This deal ends May 28, 2025, and is limited to the first 3,000 users, with 1,324 spots already claimed. Don’t miss out—act fast!
If you don't have a Blofin account, you can sign up today using the link below. If you have used a Crypto Banter link to sign up to Blofin in the past, you are already eligible for rewards with that account.
Start Trading in Minutes – Get Rewarded Instantly. Click below to see more deals. Terms and conditions apply. 👇
Chart #3 - Bitcoin (BTCUSD) 1-Day
Chartist: Dylan
(For the chart screenshot, click here.)
BTC has taken out its all-time high, and now the real test is for the bulls to step in. For lower timeframe trades, the first zone to watch is around $108,000-$106,000. However, there are reasonable support zones lower down that could easily get tapped on any weakness: $104,000-$101,000 and $98,000-$96,000. These are high-probability bounce zones, so if there is a market selloff, these are the best zones on the daily to start looking for bounce plays.
Trade it on Blofin and earn rewards here.
Get more exclusive trades from Dylan and his team by joining Chart Hackers with a 2-week free trial today! 👇
Good Morning Crypto
Bitcoin has just broken its all-time high, as we speculated it might soon, and everything points to it continuing upward. But the big question is whether altcoins will follow suit…
Subscribe below to receive today's issue of Good Morning Crypto! 👇
Chart #4 - Goatseus Maximus (GOATUSDT) 1-Hour
Chartist: Dylan’s Chart Hackers Team
(For the chart screenshot, click here.)
GOAT Trend Break Analysis
GOAT broke a trend a few days ago and has been maintaining the rising trend drawn from May 7th. I’ve got an FRVP drawn here that shows a Major Point of Control, which we have broken above and are currently sitting on.
Major Key Points
Above Point of Control
Above AVWAPs dropped from the recent move and the low of May 7th
Bullish Order Block on the trend showing on the 1-hour time frame
Bullish Divergence recently printed on the 1-hour time frame
Did a trend break/retest on May 21st
Loss of POC and rising trend would be the invalidation. I’m using low leverage.
Entry: $0.15696 - $0.16636
Take Profit:
TP1: $0.18
TP2: $0.20
TP3: $0.23
Stop Loss: 4-hour candle close under $0.15250
Trade it on Blofin and earn rewards here.
Get more exclusive trades from Dylan and his team by joining Chart Hackers with a 2-week free trial today! 👇
Chart #5 - Bubblemaps (BMTUSDT) 8-Hour
Chartist: Dylan’s Chart Hackers Team
(For the chart screenshot, click here.)
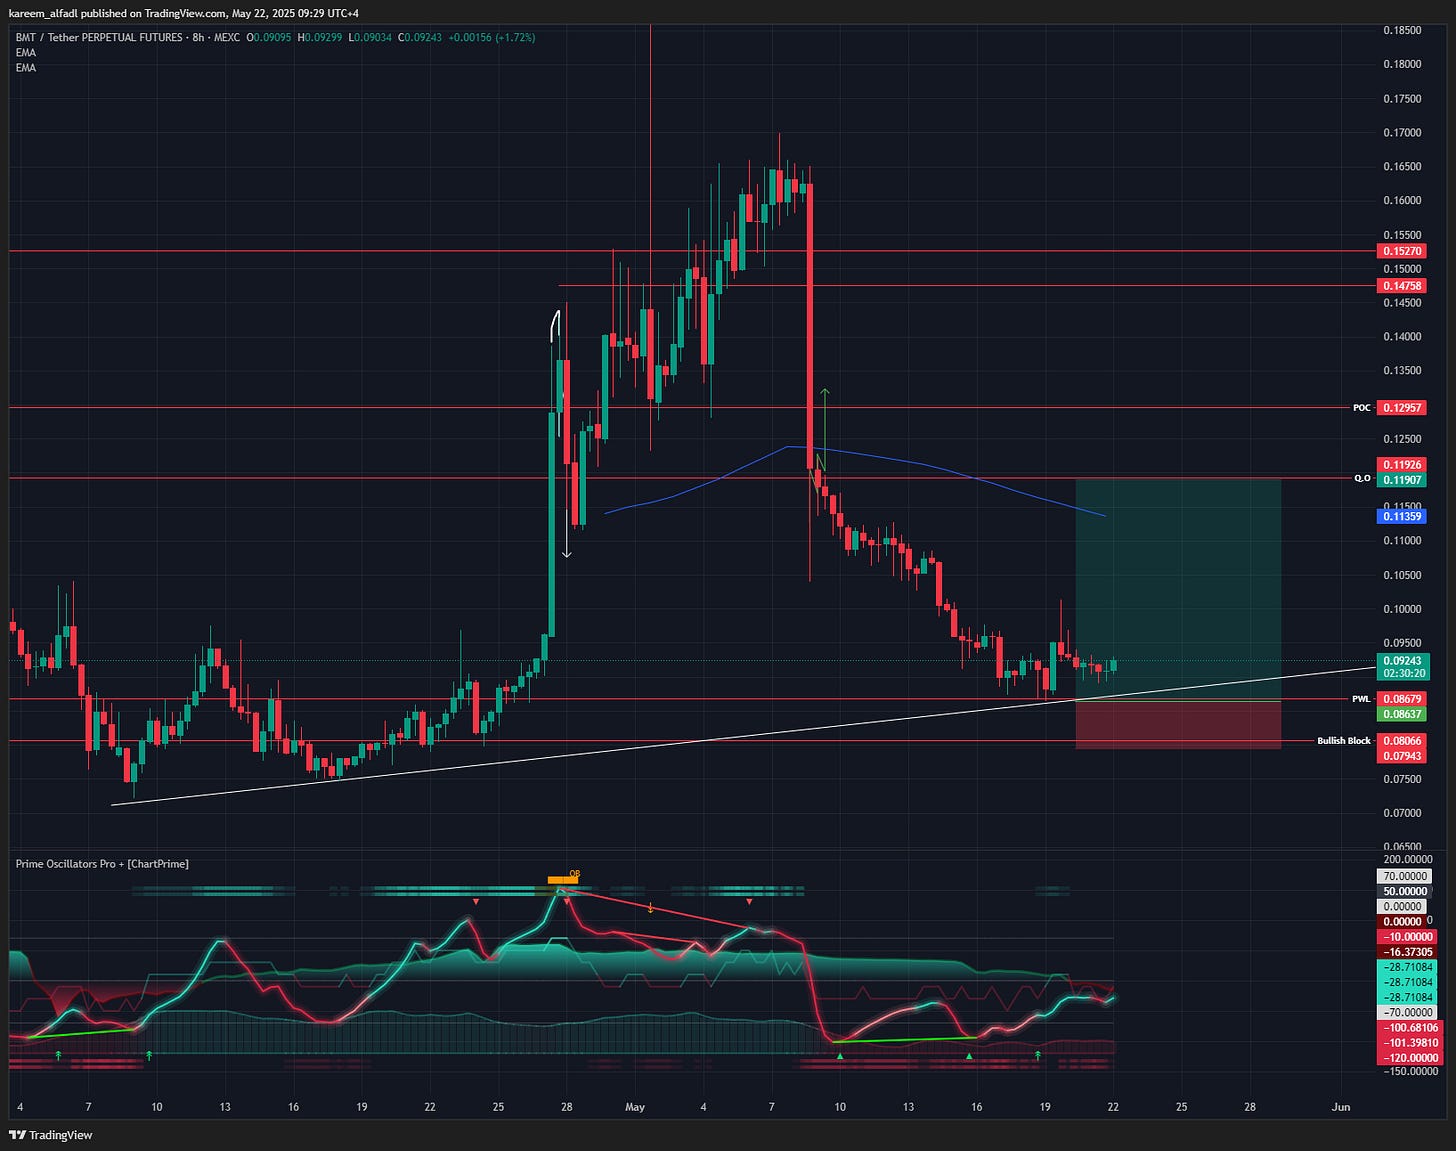
BMT - 8H Chart (Low Leverage Ladder-in Swing Idea)
Entries:
Entry 1: $0.0864 - 20% of position
Entry 2: $0.0834 - 20% of position
Entry 3: $0.0805 - 60% of position
Take Profit (TP):
TP1: $0.1011
TP2: $0.1088
TP3: $0.119
Stop Loss: 4-hour close under ~$0.0795 (7.5% wide SL that will average down with multiple entries)
Approach:
3 limit orders at 5x leverage
I’ll watch for the hold of the rising trend
I’ll observe liquidity sweep "fake move below the rising trend" with a quick recovery to the rising trend
Idea: BMT lagging behind the alts pump this week, with the majority of alts hitting their quarterly/yearly levels. Establishing last week's lows as strong support on 8H with a strong bullish order block beneath PWL sets it for a liquidity grab for a move to the upside if the market remains bullish.
Logic:
At the bottom of what could be a new higher low
Hold/retest of PWL for support
8H Stoch bullish divergence/print
Strong bullish order block level
Trade it on Blofin and earn rewards here.
Get more exclusive trades from Dylan and his team by joining Chart Hackers with a 2-week free trial today! 👇
Chart #6 - Tesla, Inc. (TSLA) 12-Hour
Chartist: Dylan
(For the chart screenshot, click here.)
(TSLA refers to the stock of the company Tesla, Inc. and not a cryptocurrency)
TSLA has responded well to recent market strength but is showing signs of rolling over at the $350 resistance region. The ideal scenario for me is a final push into the $350-$380 zone to print daily bearish divergence, where I will look to short.
Entry: $350 to $380
Take Profit (TP):
TP1: $301
TP2: $270
TP3: $220
Stop Loss: Close above $390
Get more exclusive trades from Dylan and his team by joining Chart Hackers with a 2-week free trial today! 👇


