Overview
Chart #1 - Sui (SUIUSDT) 4-Hour
Chart #2 - Bitcoin (BTC) 3-Day & Dominance
Chart #3 - Mog Coin (MOGUSDT) 4-Hour
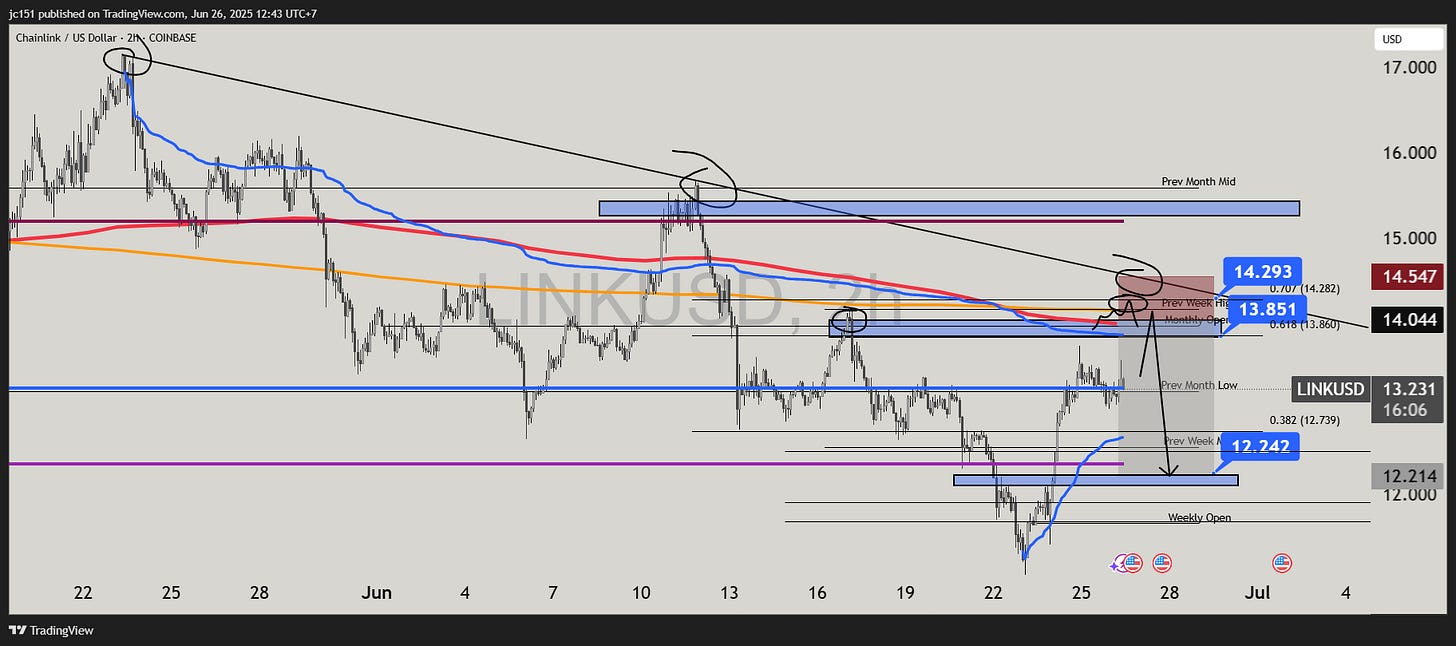
Chart #4 - Chainlink (LINKUSD) 2-Hour
Chart #5 - Bitcoin Cash (BCHUSDT) 4-Hour
Chart #6 - Venice Token (VVVUSDT) 1-Day
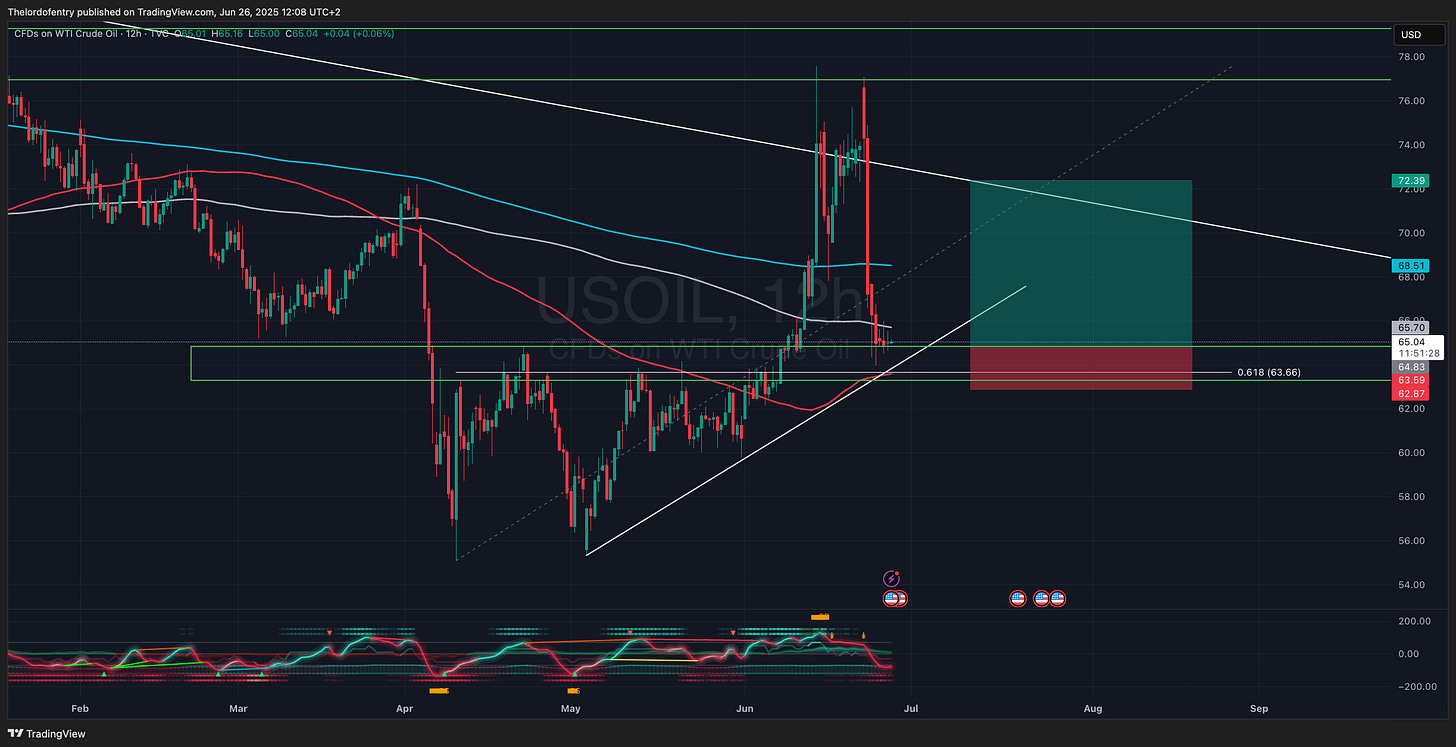
Chart #7 - WTI Crude Oil (USOIL) 12-Hour CFD
Chart #1 - Sui (SUIUSDT) 4-Hour
Chartist: Dylan
(For the chart screenshot, click here.)
SUI has shown relative strength over the past few days but is starting to dip. I’m targeting a strong move in the $2.53 to $2.42 region, ideally delivering a 15% move toward the Volume-Weighted Average Price (VWAP) from the June highs. The key is the alignment of price levels with the 4-hour oscillator reset, which typically provides reliable swing opportunities in both directions.
Entry: $2.53 - $2.42
Stop Loss: Close below $2.40
TP1: $2.59
TP2: $2.70
TP3: $2.85
Limited Time Offer: Get 2 Weeks Free Access!
Get more exclusive trades from Dylan and his team by joining Chart Hackers with a 2-week free trial today! 👇
Join now to:
Access exclusive automated trading bots and indicators.
Join a private trading community on Discord & Telegram.
Learn expert entry and exit strategies from top traders.
Get real-time insights and high-level trade ideas.
Suitable for both beginners and advanced traders.
Chart #2 - Bitcoin (BTC) 3-Day & Dominance
Chartist: Dylan
Bitcoin (BTCUSD) 3-Day
(For the chart screenshot, click here.)
Currently at the upper resistance zone around $108,000.
Ideally, I’d like to see a close above this level on this timeframe to feel more bullish.
BTC Dominance (BTC.D) 12-Hour
(For the chart screenshot, click here.)
A great indicator for when altcoins might bounce or face rejection.
Using simple technical analysis (TA) at key levels, you can see that BTC dominance has now bounced off support, which is reflected in the current dip in altcoins we’re seeing this morning.
A strong area to watch for an altcoin bounce is the yellow circle, around and below 66%.
Get more exclusive trades from Dylan and his team by joining Chart Hackers with a 2-week free trial today! 👇
Chart #3 - Mog Coin (MOGUSDT) 4-Hour
Chartist: Dylan’s Chart Hackers Team
(For the chart screenshot, click here.)
MOG claimed major rising trend/POC and attempting to take out previous weekly highs similar to many altcoins. Any throw backs to the 0.382 Fib are considered bullish if MOG holds 4h POC.
I see a possible long leading into a short opportunity on the 4h.
Long Idea
Leverage: 5x
Entry: Between $0.0000008912 - $0.00000085
Stop Loss: 4h close under $0.000000843
TP1: $0.00000094
TP2: $0.000000997
TP3: $0.000001045
Short Idea
Leverage: 5x
Entry: Between $0.000001037 - $0.000001079
Stop Loss: 4h above $0.000001084
TP1: $0.000000962
TP2: $0.000000905
Get more exclusive trades from Dylan and his team by joining Chart Hackers with a 2-week free trial today! 👇
Chart #4 - Chainlink (LINKUSD) 2-Hour
Chartist: Dylan’s Chart Hackers Team
(For the chart screenshot, click here.)
Price is retracing back into a key confluence zone that includes the 50 EMA, 100 SMA, and a downtrend line. This area aligns with the 0.618 fib retracement of the recent leg down and the anchored VWAP from 23rd May.
The monthly open sits right above as a magnet for price before a potential reversal, with a likely wick into the previous weekly high to run liquidity. If this zone rejects, it sets up a clean short idea into the next swing low.
Entry: $13.85 – $14.29
TP1: $12.23
TP2: $12.00
Stop Loss: $14.60
Get more exclusive trades from Dylan and his team by joining Chart Hackers with a 2-week free trial today! 👇
Chart #5 - Bitcoin Cash (BCHUSDT) 4-Hour
Chartist: Dylan’s Chart Hackers Team
(For the chart screenshot, click here.)
Low leverage short reversal range trade idea.
Entry is determined by a combination of a bearish order block, premium zone, and a double top pattern. Stop loss (SL) is placed above the premium zone with a tight stop loss. Take-profit levels (TP1 and TP2) are based on a 0.618 Fibonacci retracement and the equilibrium zone. TP3 targets a push down toward the bullish order block and the Point of Control (POC). Confluence is supported by the RSI topping out and turning downward, with cash flow also showing signs of continued bearish momentum. The MACD will be monitored for clear reversal signals, with green bars expected to diminish. On the price action, we will look for engulfing candles.
The trade is easily invalidated if the price breaks above the premium zone and makes new highs with continued upside momentum. This setup features a low-risk stop loss. All eyes are on Bitcoin and war-related news or developments signaling the end of the war.
Entry: $504 region
TP1: $462 region (8% profit)
TP2: $449 region (11% profit)
Approx a 6:1 trade if TP2 hits
TP3: $427 region if you wish to try a moon short
Stop Loss: $515 region (candle close above) - roughly 2%
Get more exclusive trades from Dylan and his team by joining Chart Hackers with a 2-week free trial today! 👇
Chart #6 - Venice Token (VVVUSDT) 1-Day
Chartist: Dylan’s Chart Hackers Team
(For the chart screenshot, click here.)
VVV recently bounced off a macro 0.786 Fibonacci level during the Sunday war sell-off, confirming a second daily bullish divergence.
It has reclaimed the Value Area Low and is holding above the recent Anchored Volume-Weighted Average Price (AVWAP) from the low. The price is currently testing the 0.382 retracement but may pull back to the 0.786 level or the trendline if BTC undergoes a correction.
Fundamentally, VVV (Venice.ai) has a bullish narrative, and given this bullish setup, I anticipate a potential 30%+ move in the short term.
Entry: $2.45 through $2.74
TP1: $3.00
TP2: $3.40
TP3: $3.80
TP4: $4.40
Stop Loss: $2.20 (a 4-hour candle close below)
Get more exclusive trades from Dylan and his team by joining Chart Hackers with a 2-week free trial today! 👇
Chart #7 - WTI Crude Oil (USOIL) 12-Hour CFD
Chartist: Dylan
(For the chart screenshot, click here.)
War-related news has introduced significant volatility to the oil price, but prior to the recent events, WTI/USOIL was printing higher lows into horizontal resistance, which triggered an upside breakout. Following the quick sell-off, this setup may offer a short-term bounce opportunity to clear liquidity above and capture late shorters. The risk is approximately 3%, with a potential upside of 5% to 11%. There is strong confluence of support in the current region, reinforced by the 50-day moving average (MA).
Entry: $64.50 - $63.50
Stop Loss: A close below $63.00
TP1: $68.40
TP2: $71.90
Get more exclusive trades from Dylan and his team by joining Chart Hackers with a 2-week free trial today! 👇


