

Nasdaq & S&P 500 Retracting! THIS is Where We BUY $COIN!
Nasdaq & S&P 500 Retracting! THIS is Where We BUY $COIN!
Despite the stock market's downturn, Bitcoin remains resilient.
Overview
Chart #1 - Ethereum (ETHUSDT) Daily
Chart #2 - Invesco QQQ Trust (QQQ) Daily
Chart #3 - Coinbase (COIN) Weekly
Chart #4 - Theta (THETAUSDT) Daily
Chart #5 - Fear and Greed Index

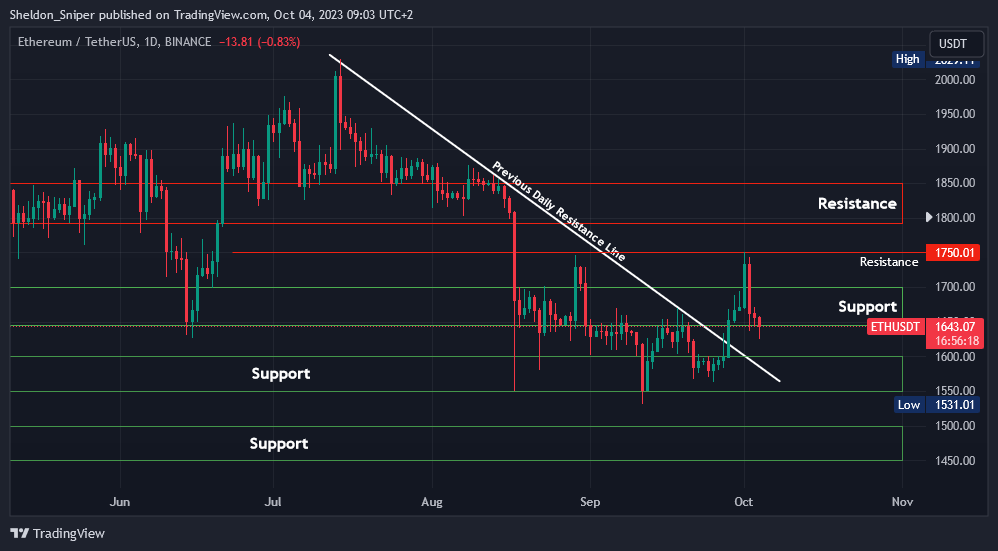
Chart #1 - Ethereum (ETHUSDT) Daily
Chartist: Sheldon
(For the chart screenshot, click here.)
After the price of ETH was rejected at $1,750 earlier in the week, it retraced to test the $1,650 support level, which has held for the last three days. This is the same level that acted as resistance for most of September, which should hold if the price of BTC doesn't retrace further.
I believe ETH has another move up, and if the price can break through $1,750, the next resistance is at $1,800 - $1,850, an area last tested in July and part of August.
Sign-up and trade on Bybit today.
Exclusive $30,000 deposit rewards and bonuses up for grabs!
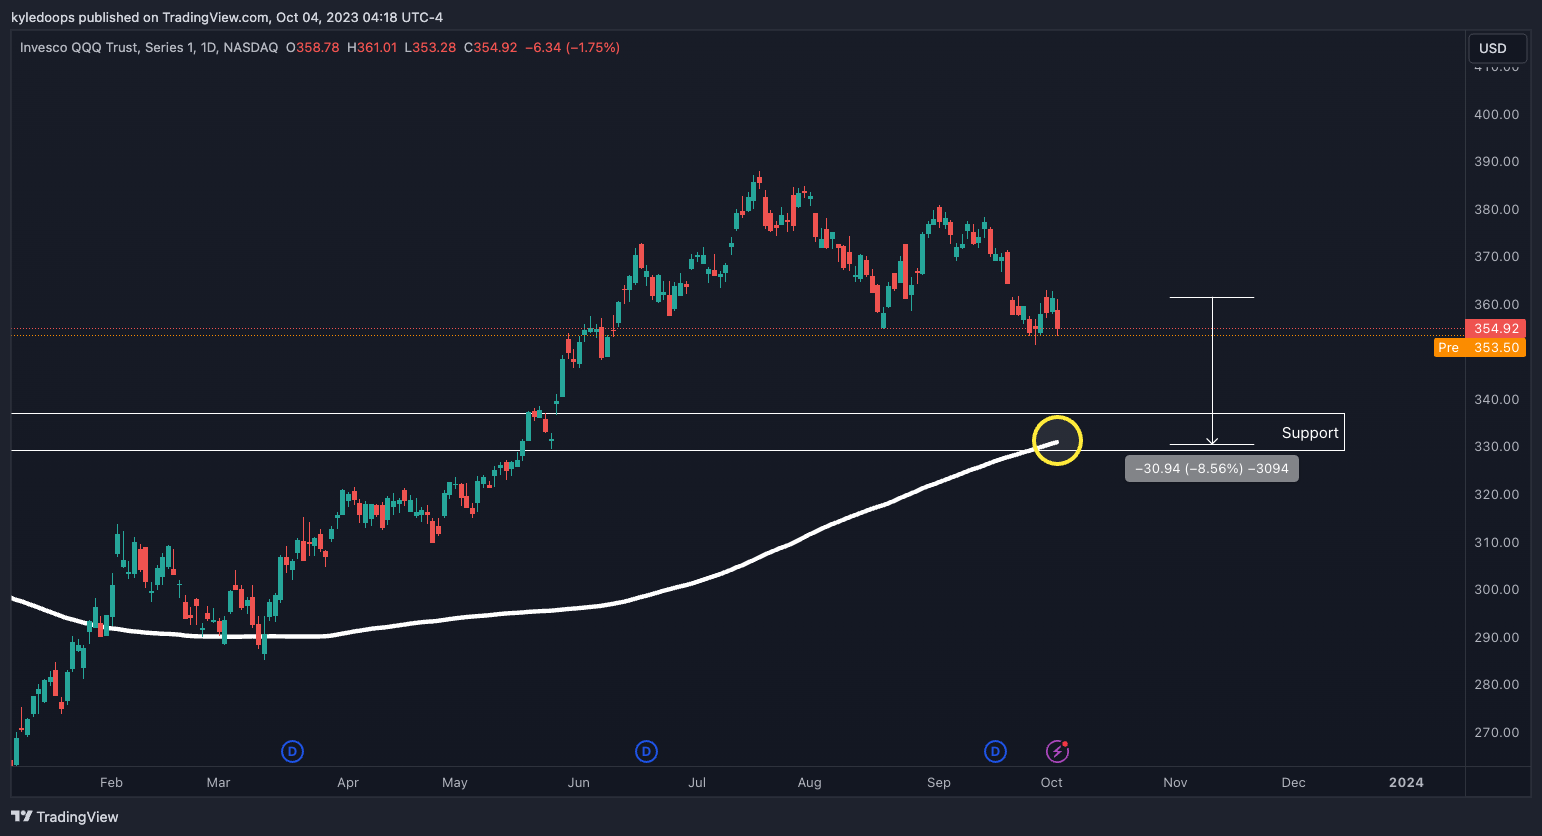
Chart #2 - Invesco QQQ Trust (QQQ) Daily
Chartist: Kyle
(For the chart screenshot, click here.)
QQQ, which represents tech stocks, is pulling back. I perceive this more as a bullish reset than a significant sell-off risk.
Look for a rebound around 330, aligning with the 200-day moving average. This also offers robust horizontal support and is the first retest since breaking out from a key horizontal level.
Claim your Bitget sign-up bonuses here (details below).
Chart #3 - Coinbase (COIN) Weekly
Chartist: Kyle

(For the chart screenshot, click here.)
With the Nasdaq & the S&P 500 retracting, Coinbase will probably follow suit.
The initial region to watch for a potential bounce is $58. If that doesn't hold, a return to the range lows will be my next target for purchasing Coinbase stock, anywhere between $30 and $50.
Claim your Bitget sign-up bonuses here (details below).
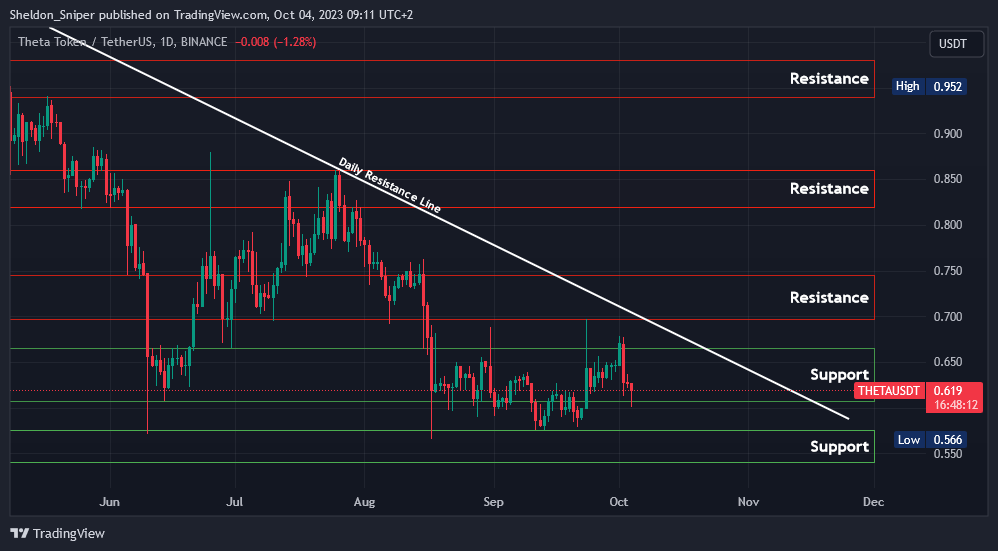
Chart #4 - Theta (THETAUSDT) Daily
Chartisheldon
(For the chart screenshot, click here.)
After testing and being rejected at the $0.70 resistance level two weeks ago, the price of THETA retraced to the $0.60 support level, potentially offering another opportunity for a long trade upward.
The price has stabilized in this area for the past three days and might be gearing up to test the next resistance at $0.66.
If the $0.60 level breaks, the next support range lies between $0.54 and $0.57, an area tested last month.
Claim your Bitget sign-up bonuses here (details below).
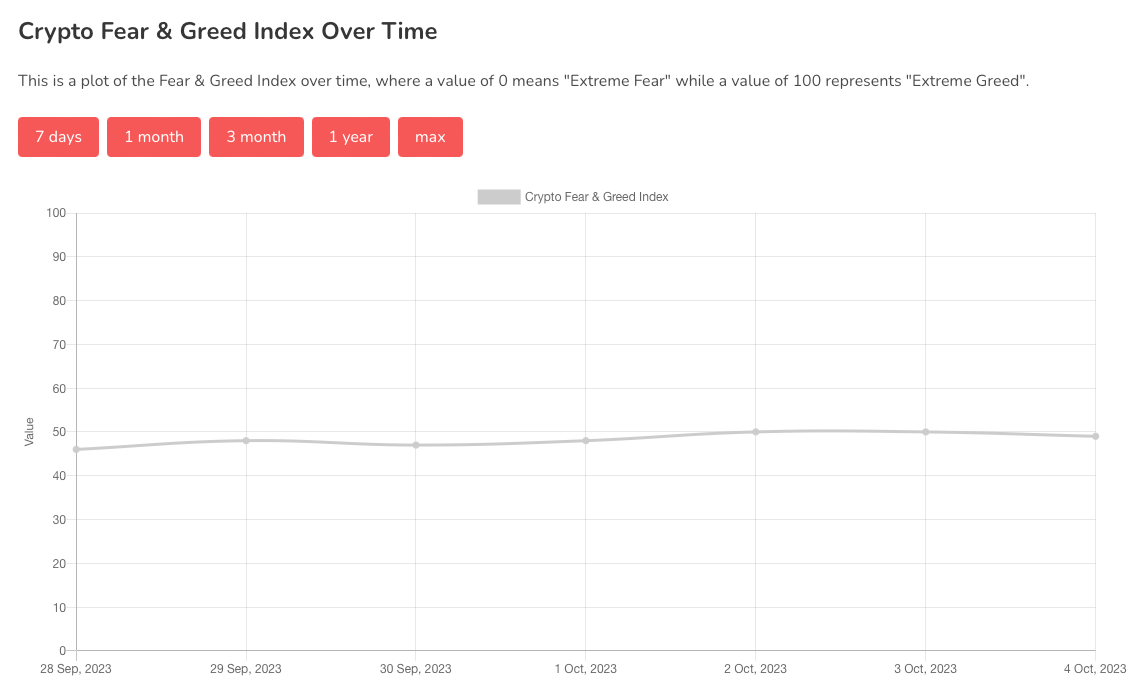
Chart #5 - Fear and Greed Index
The Fear and Greed Index is sitting at 49 today, Neutral.
The highest the index has been over the past seven days is 50, and the lowest is 46.
Banter’s Take
Despite the stock market's downturn, Bitcoin remains resilient. Bulls aim to defend the $25,000 mark to maintain upward momentum.
Stay safe my friends!
Go to our Crypto Banter Discord here where Sheldon and Kyle give updates on the charts and trades from The Daily Candle newsletter!