

📈📉 NEAR and DOT Trade Setups!
Overview
Chart #1 - Crypto Total Market Cap (TOTAL) Daily
Chart #2 - Near (NEARUSDT) 8-Hour
Chart #3 - Polkadot (DOTUSDT) 8-Hour
Chart #4 - Solana (SOLUSDT) Daily
Chart #5 - Fear and Greed Index
Chart #1 - Crypto Total Market Cap (TOTAL) Daily
Chartist: Sheldon
(For the chart screenshot, click here.)
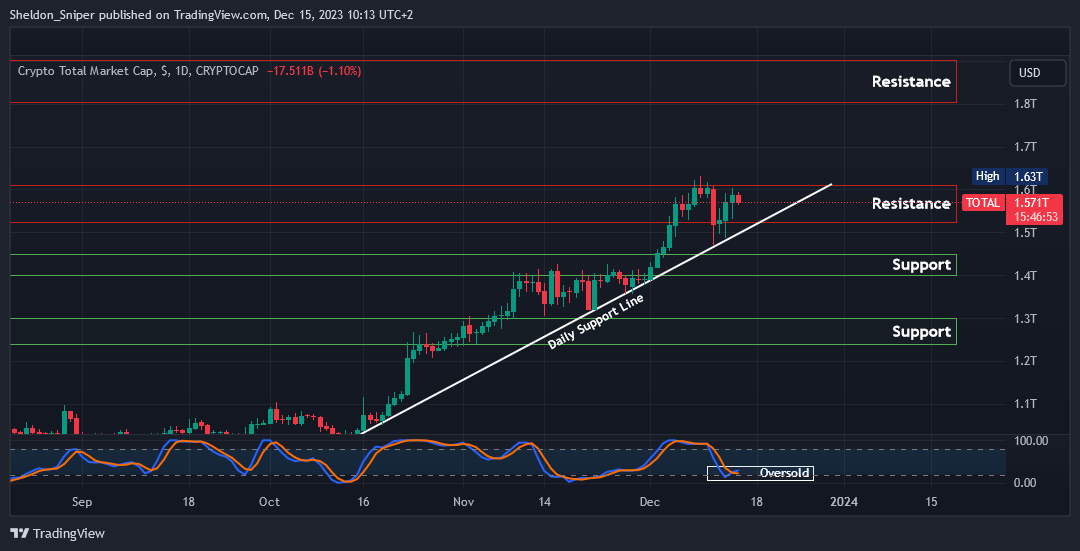
Yesterday, the TOTAL was rejected at the upper resistance level of $1.62 trillion, then fell to the lower range of $1.53 trillion where it found support.
Currently, it stands at $1.57 trillion.
Given that the Stochastic RSI is oversold on the daily, it's likely the market will stay in this range for a few days before trying to reach the high again.
If it breaks through, the next target will be between $1.8 trillion and $1.9 trillion. However, if the market drops further and breaks below both the $1.53 trillion support and the ascending daily support line, the next significant support zone is between $1.4 trillion and $1.45 trillion.
Exclusive $30,000 deposit rewards and bonuses up for grabs!
Chart #2 - Near (NEARUSDT) 8-Hour
Chartist: Sheldon
(For the chart screenshot, click here.)
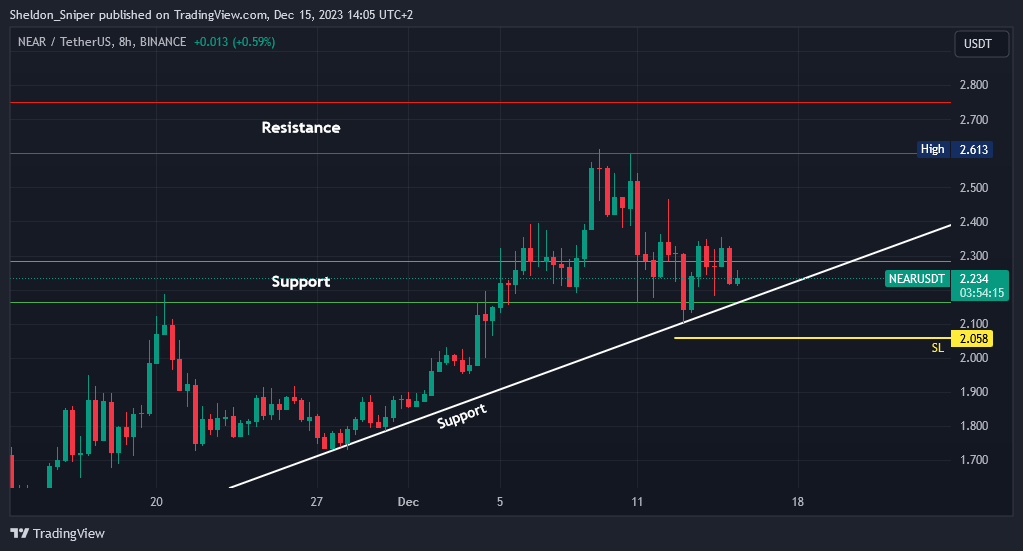
I am considering taking a spot long trade on NEAR.
With an entry in the support zone between $2.15 - $2.27, and a Take Profit (TP) at the next area of resistance at $2.60 - $2.75.
My stop loss (SL) will be set below both the range low support of $2.15 and the ascending support line, at around $2.05.
Sign-up and trade on Bybit today.

Outsmart 99% Of The Market!
Get full access into our Discord And Telegram group, where you'll find all of our premium content!
👉 Trade Signals!
👉 Trade Set-Ups!
👉 Trading Challenges!
👉 Education!
👉 SO MUCH MORE!
Chart #3 - Polkadot (DOTUSDT) 8-Hour
Chartist: Sheldon
(For the chart screenshot, click here.)
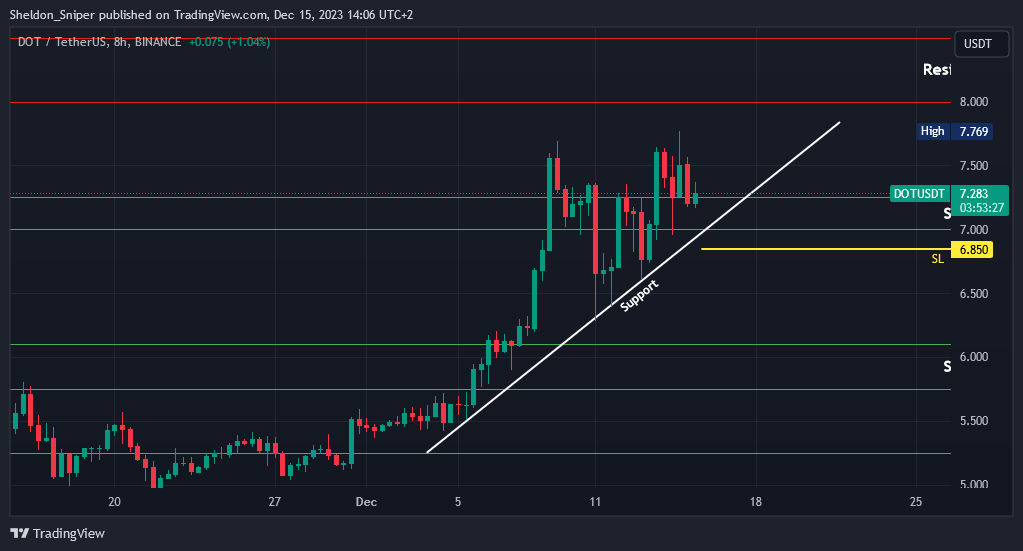
DOT is currently on the $7.30 top of the range support.
I'm looking for a long spot trade to the next resistance area of $8.00 - $8.50, where I will take profits (TP).
My stop loss is set just below the bottom of the range low support, at $6.85.
Claim your Bitget sign-up bonuses here (details below).
Chart #4 - Solana (SOLUSDT) Daily
Chartist: Sheldon

(For the chart screenshot, click here.)
SOL is currently at $76.
With the Stoch RSI on the daily oversold, SOL should consolidate here for a few days before breaking through the $78 level of resistance.
If the daily support line at around $65.00 is lost, it could head to $58.00 - $60.00.
Claim your Bitget sign-up bonuses here (details below).
Chart #5 - Fear and Greed Index
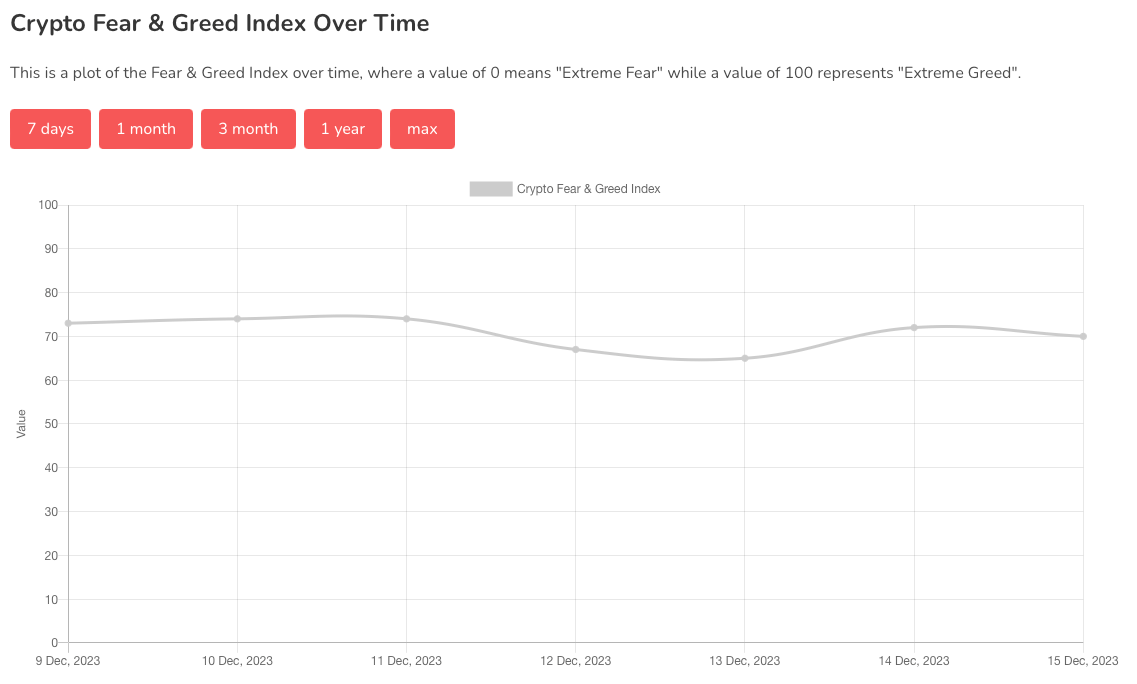
The Fear and Greed Index is sitting at 70 today, indicating Greed.
The highest the index has been over the past seven days is 72, and the lowest is 60
Banter’s Take
After rallying for the last two days, Bitcoin is consolidating just under the $43,000 level of resistance.
A break of that resistance could take BTC to $46,000 - $48,000.
If the market retraces from here, important levels to watch are the bottom of the CME gap at around $39,400, and also the previous resistance level of $38,000, which is now support.
Stay safe my friends!
Go to our Crypto Banter Discord here where Sheldon and Kyle give updates on the charts and trades from The Daily Candle newsletter!
DAILY CANDLE...I MISS YOU...PLEASE COME BACK.....CHRIS