

📈📉 NEAR Long Trade Revealed! 35% Opportunity on SOL!
📈📉 NEAR Long Trade Revealed! 35% Opportunity on SOL!

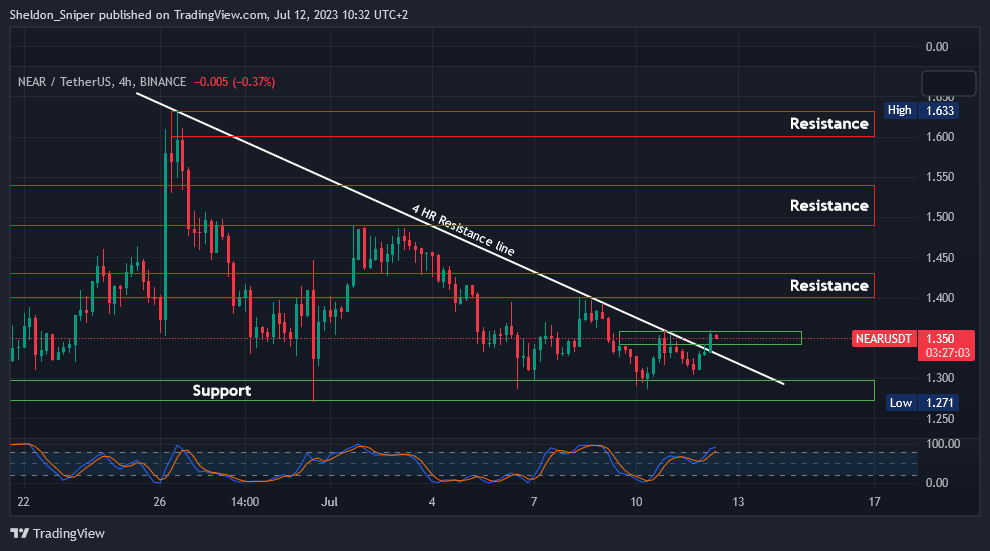
Chart #1 - Near (NEARUSDT) 4-Hour Chart
Chartist: Sheldon
(For the chart screenshot, click here.)
I am looking at NEAR for a potential long entry, as it has just broken out of the 4-hour descending resistance line and is currently in a support zone at $1.34 - $1.35.
My first target will be the next resistance level at $1.40, and the second at will be $1.50, which also coincides with the 0.618 fib retracement.
I’ll set my stop loss slightly below the current low and the next support level, at $1.27. But, remember, today is US CPI data print day, so it might be better to enter any trades only after the print.
Sign-up and trade on Bybit today.
Exclusive $30,000 deposit rewards and bonuses up for grabs!
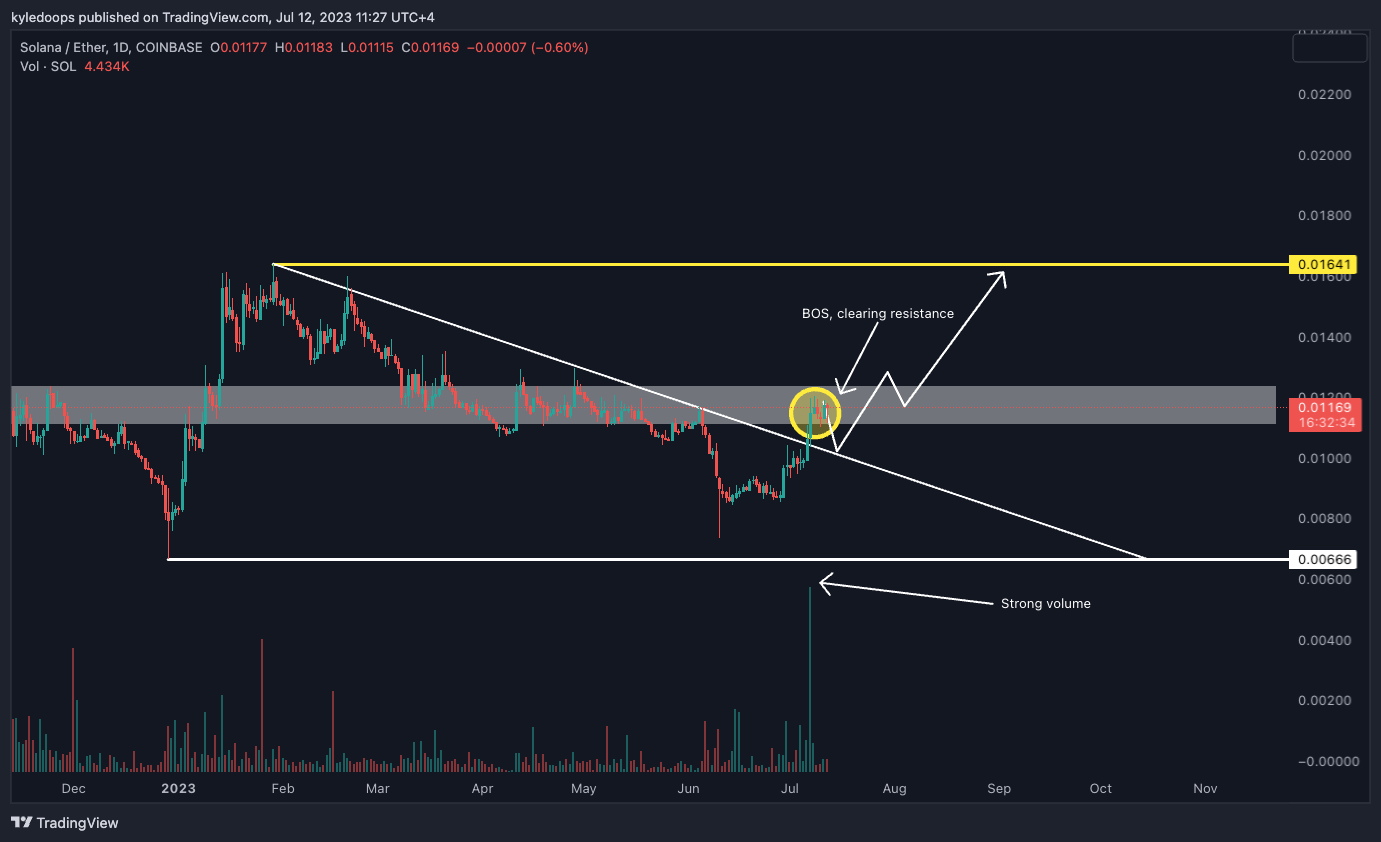
Chart #2 - Solana to Ethereum Ratio (SOLETH) 1-Day Chart
Chartist: Kyle
(For the chart screenshot, click here.)
SOL has broken the structure on the daily against ETH, closing above the prior lower high and getting above the diagonal trend line.
If it consolidates above 0.01169, then it likely leads to a continuation higher. In that instance, you could see a move up to 0.01641.
Only once it breaks above 0.0169, have we cleared the range. And check out SOL to USD below.
𝗣𝗿𝗶𝗺𝗲 𝗫𝗕𝗧
Sign up for a new Trading Account on Prime XBT!
Receive a deposit bonus of up to $7,000 with promo code: KyleDoops

Sign up for a new Trading Account on Prime XBT!
Receive a deposit bonus of up to $7,000 with promo code: SheldonSniper
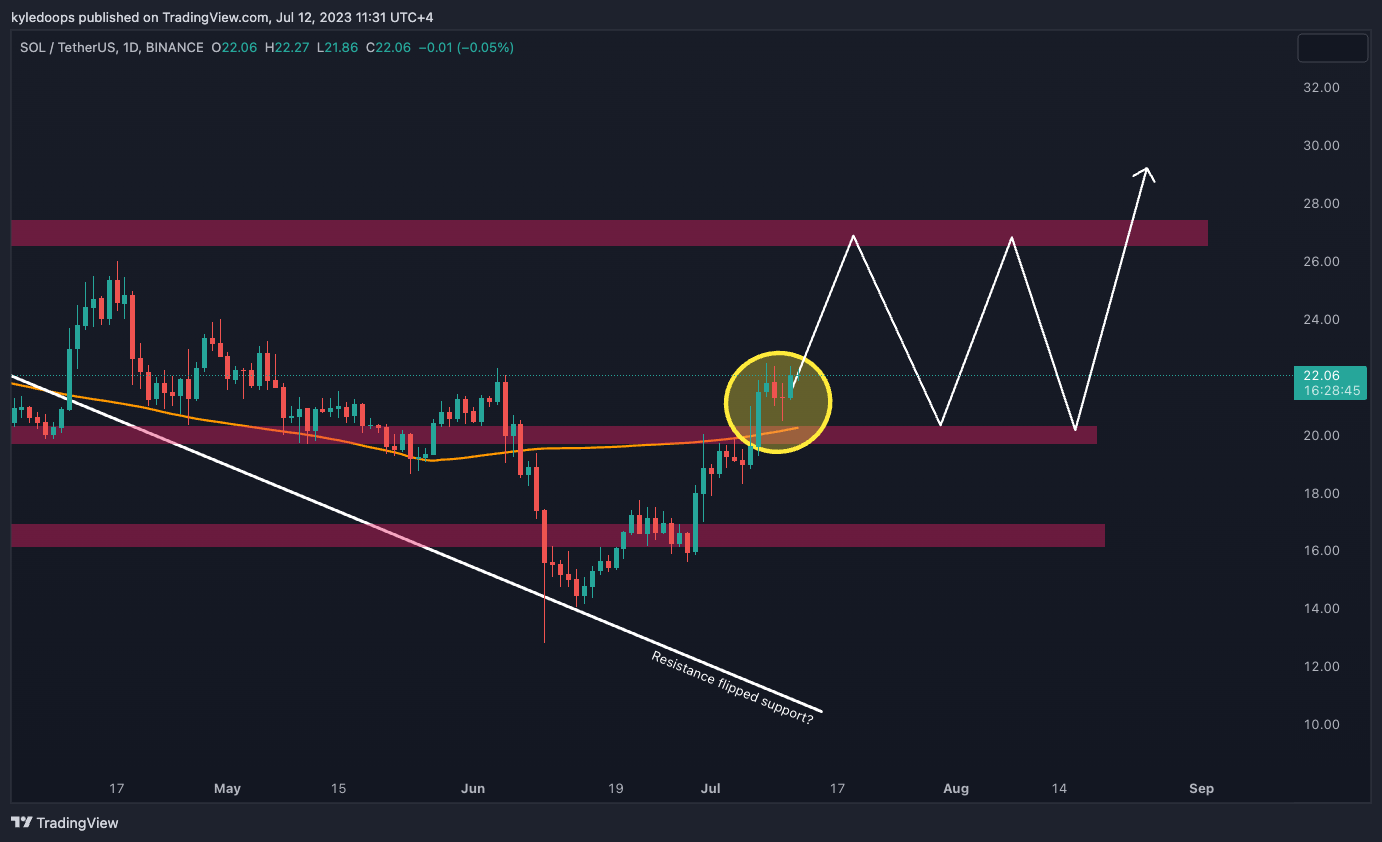
Chart #3 - Solana (SOLUSDT) 1-Day Chart
Chartist: Kyle
(For the chart screenshot, click here.)
What the above-mentioned SOL/ETH situation means for the USD pair is that the price has reclaimed the 200-day moving average and also cleared important resistance.
This suggests that a new range could be forming between $20 and $27.
And that represents a 35% range opportunity.
Claim your Bitget sign-up bonuses here (details below).
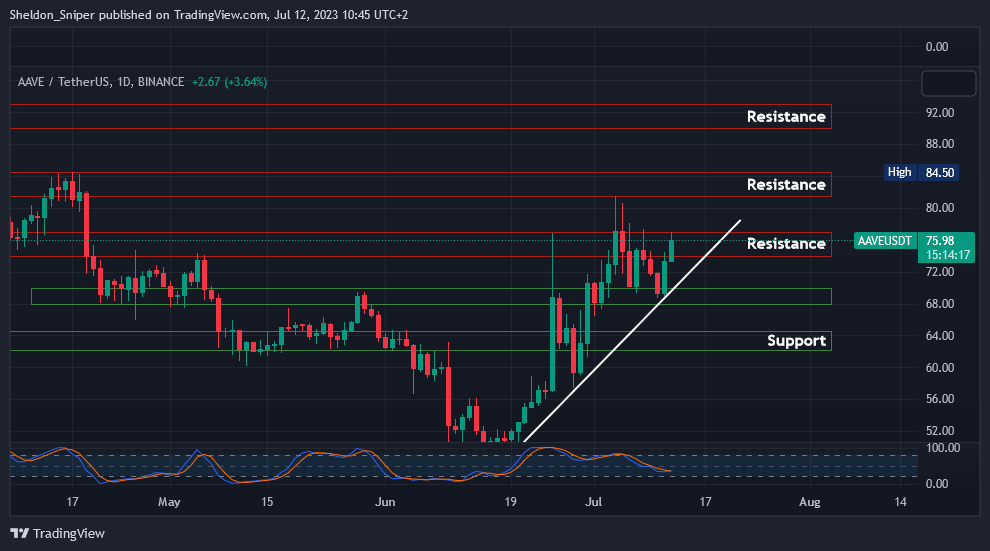
Chart #4 - Aave (AAVEUSDT) 1-Day Chart
Chartist: Sheldon
(For the chart screenshot, click here.)
On the 28th of June, I entered a long trade on AAVE at $60. Since then, the price increased to roughly $82 before experiencing a minor retracement.
Now it’s at $76, trading within the $74 - $76 resistance zone. If the price can breach the $76 level, it may pave the way for a test of the next resistance between $82 - $85, and subsequently between $90 - $93.
However, if the price is rejected here, the following support area lies between $68 - $70.
Claim your Bitget sign-up bonuses here (details below).
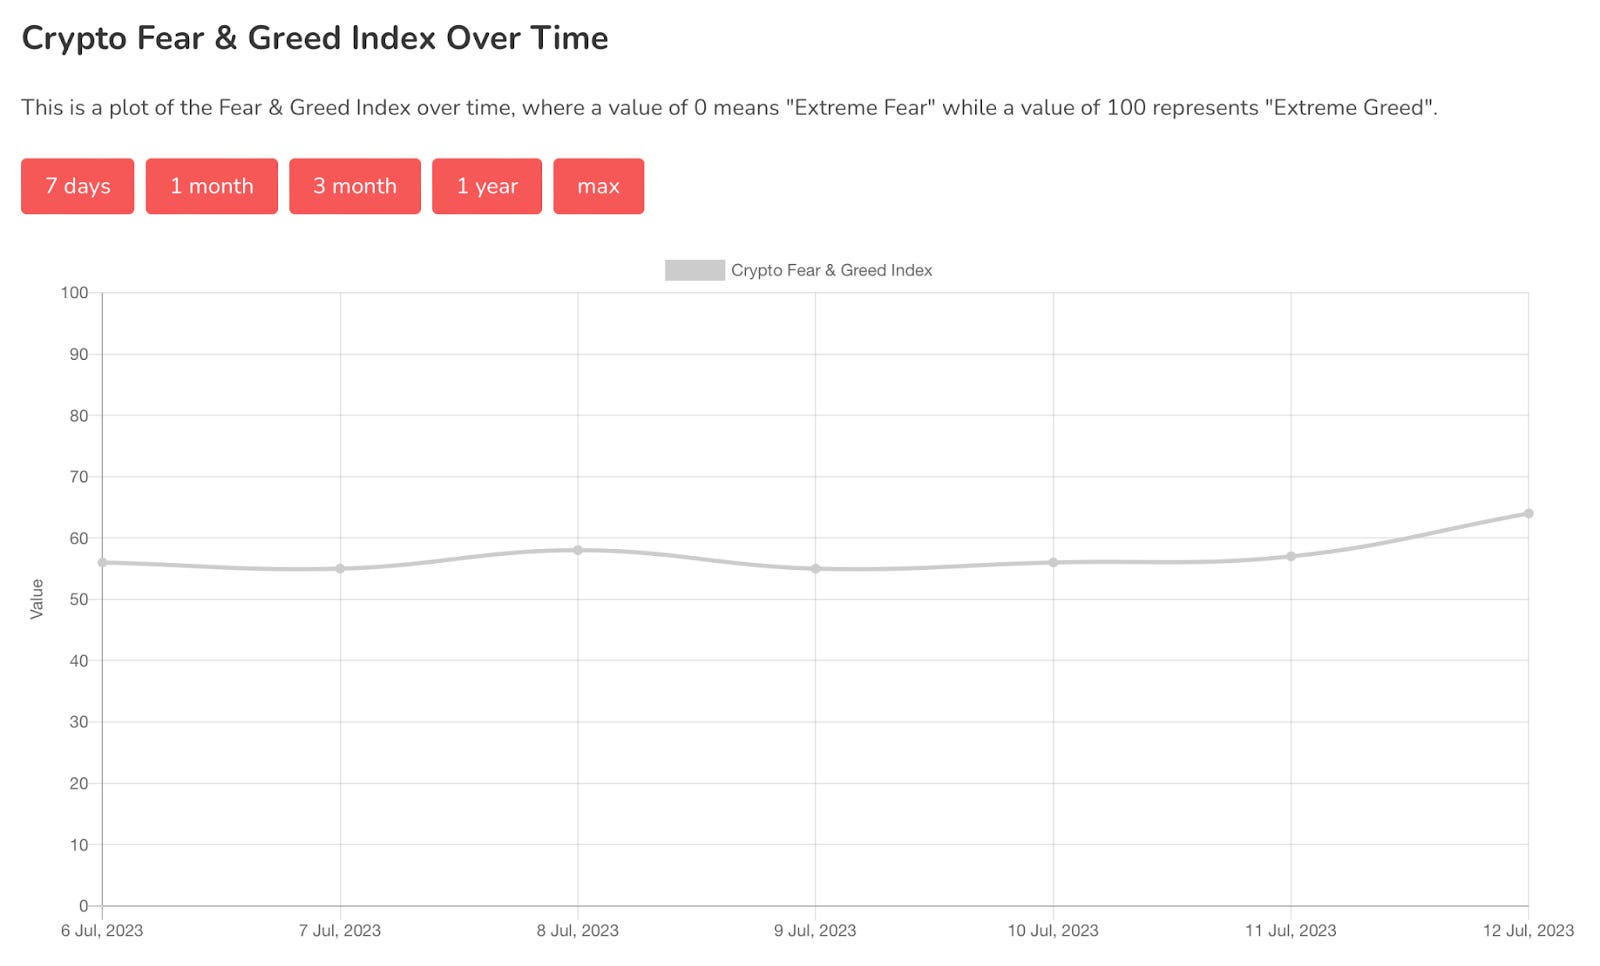
Chart #5 - Bitcoin Fear and Greed Index
The Bitcoin Fear and Greed Index is sitting at 64 today, indicating Greed.
The highest the index has been over the past seven days is 64, and the lowest is 55.
Banter’s Take
The market is awaiting the much anticipated CPI inflation data print, so expect volatility. Bitcoin’s price range is $30,500 to $31,500. Price will likely sweep one side and break back into the range after that.
Stay safe my friends!
Go to our Crypto Banter Discord here where Sheldon and Kyle give updates on the charts and trades from The Daily Candle newsletter!
Love your work :)