

📈📉 Next BTC Target: ATH or Back to $55K?
📈📉 Next BTC Target: ATH or Back to $55K?
NEAR Primed to PUMP?
Overview
Chart #1 - The Graph (GRTUSDT) 12-Hour
Chart #2 - Kaspa Network (KASUSDT) Daily
Chart #3 - Near (NEARUSDT) 4-Hour
Chart #4 - Bitcoin (BTCUSD) 12-Hour
Chart #5 - Fear and Greed Index
Chart #1 - The Graph (GRTUSDT) 12-Hour
Chartist: Sheldon

(For the chart screenshot, click here.)
A lot of alts are still trading at support.
For GRT, price has been consolidating at support over the last week.
Entry: Enter into a long spot trade at the current level of support, at around $0.33
Take Profit (TP)
TP1: $0.4150 - $0.4350 (26% - 32%)
TP2: $0.4750 - $0.4950 (44% - 50%)
Stop Loss: Just below $0.3150
Sign-up and trade on Bybit today.
Exclusive $30,000 deposit rewards and bonuses up for grabs!
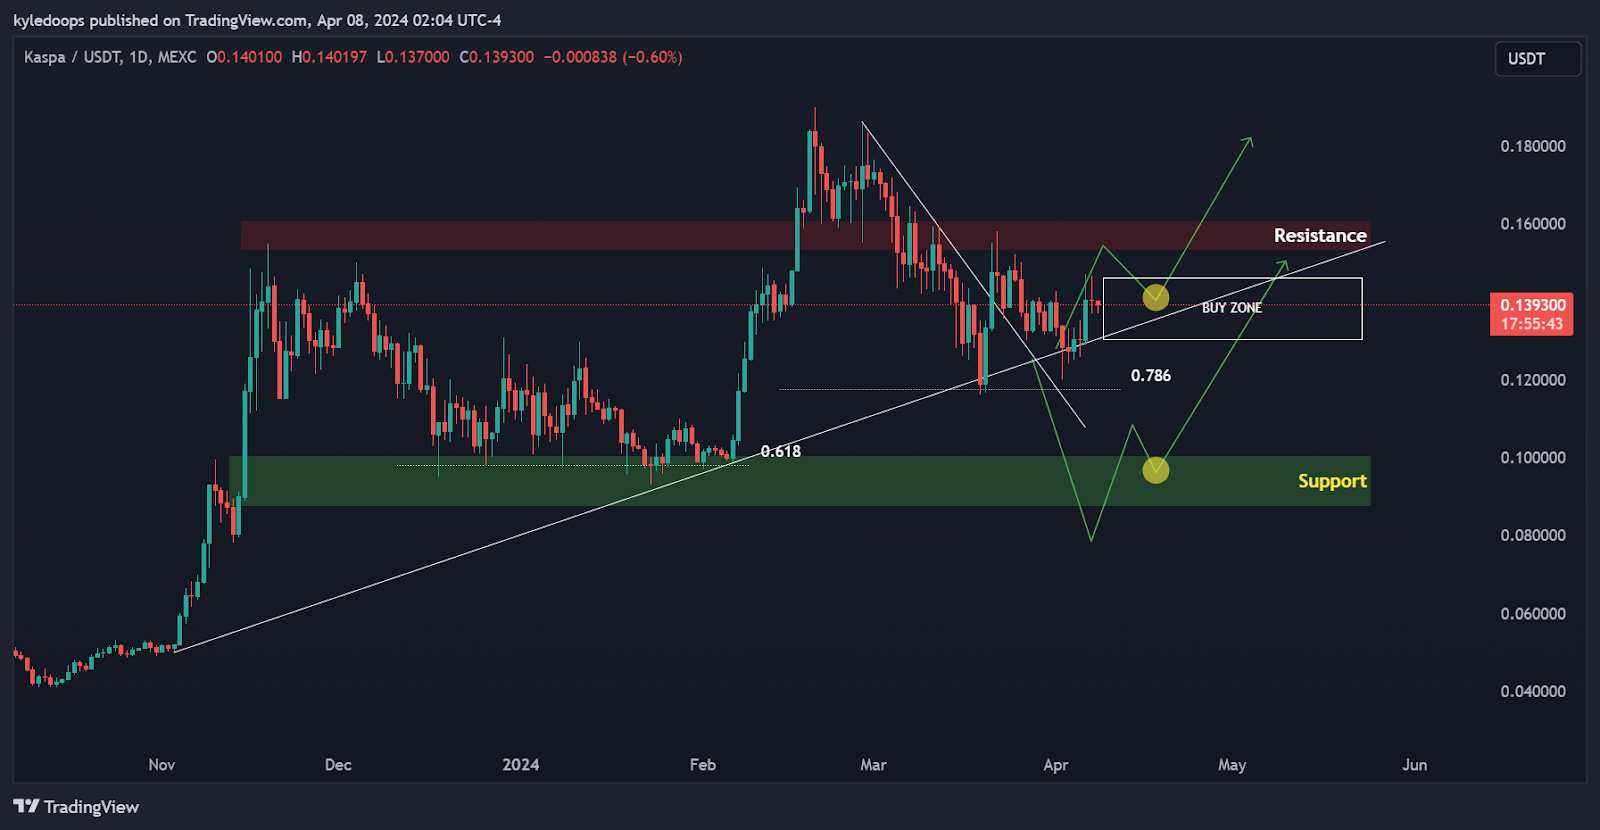
Chart #2 - Kaspa Network (KASUSDT) Daily
Chartist: Kyle
(For the chart screenshot, click here.)
KAS has been consolidating above $0.12 for the last few weeks and is now setting a higher low onto trend at $0.127, marking out a potential bottom to the range.
With price gaining acceptance above $0.16 we can expect a trend continuation to ATH's. We’ll watch price action in this area for further indications of a shift in trend, building a position on higher lows, anticipating a break into price discovery.
Entry: Between $0.13 to $0.14500
TP1 $0.25 (70%)
TP2 $0.35 (140%)
TP3 $0.5 (210%) Moonshot
Stop Loss: Price losing $0.12 support
Claim your Bitget sign-up bonuses here (details below).

Outsmart 99% Of The Market!
Get full access into our Discord And Telegram group, where you'll find all of our premium content!
👉 Trade Signals!
👉 Trade Set-Ups!
👉 Trading Challenges!
👉 Education!
👉 SO MUCH MORE!
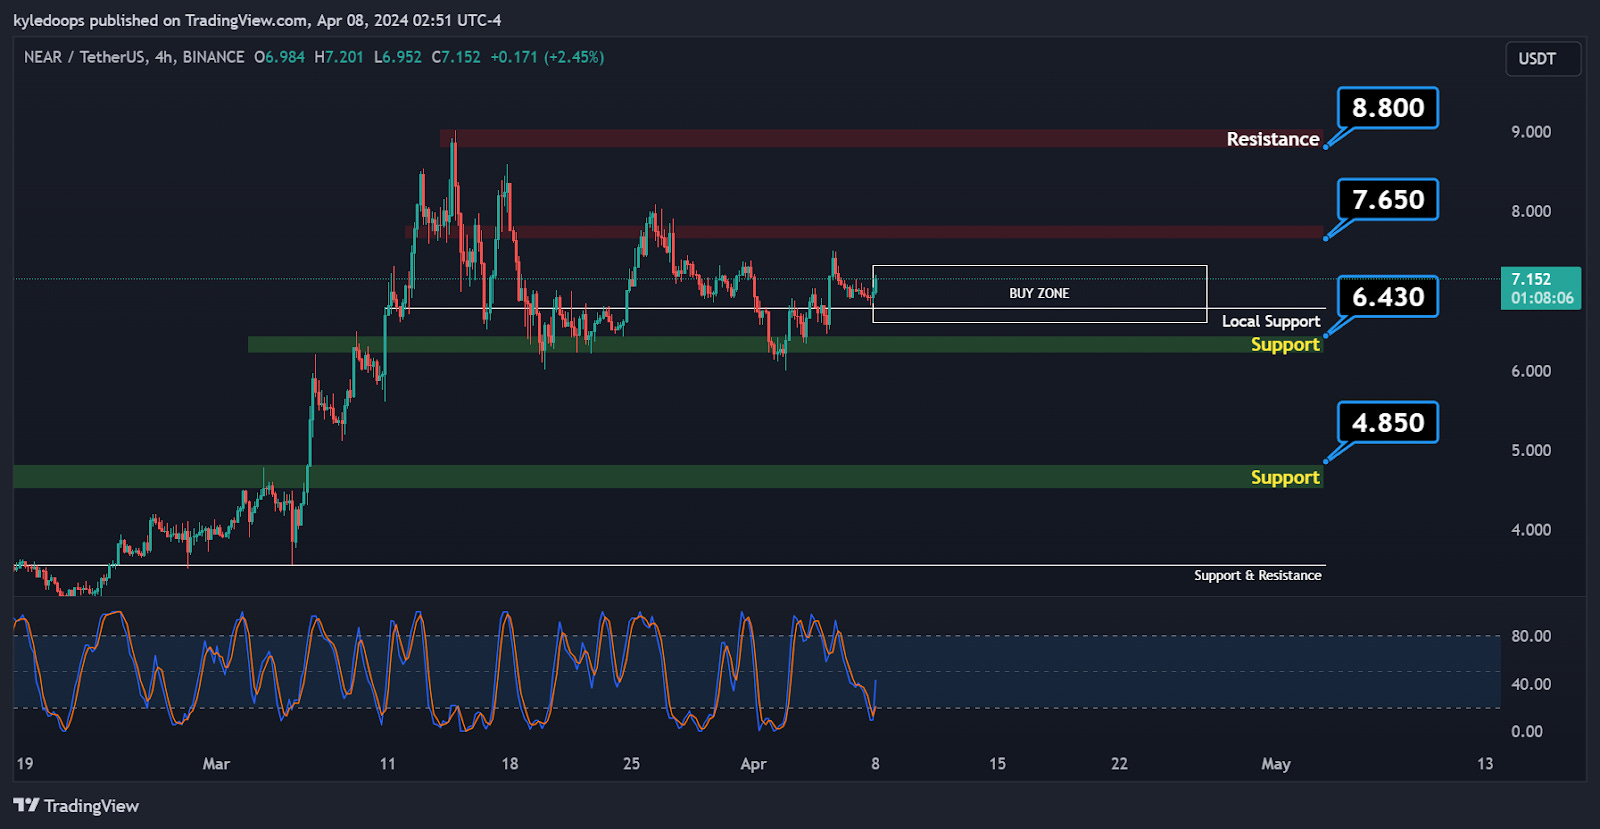
Chart #3 - Near (NEARUSDT) 4-Hour
Chartist: Kyle
(For the chart screenshot, click here.)
NEAR has found support above $6.80 setting in a double bottom at $6.14. Expectation is for the support of $6.14 to hold and price to move up to retest the previous highs of $8.80.
Entry: $6.60 to $7.4
TP1: $8.8 (35%)
TP2: $10 (55%)
Stop Loss: Price loosing $6.1
Claim your Bitget sign-up bonuses here (details below).
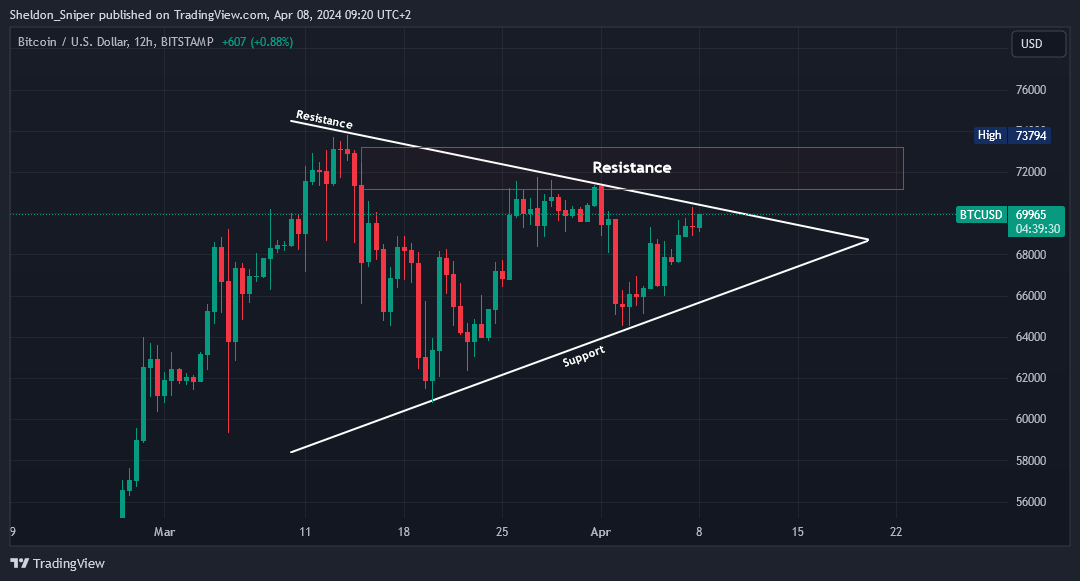
Chart #4 - Bitcoin (BTCUSD) 12-Hour
Chartist: Sheldon
(For the chart screenshot, click here.)
Over the last month, Bitcoin has been consolidating in a range between a low of $61,000 and a high of $73,700.
Over that time, price has formed a bullish pennant structure, where it looks like BTC is getting ready to break out through the top resistance line at around $70,000. If it does break out, there is still the overhead area of resistance between $71,200 - $73,800.
We need to watch whether it can break through that area of resistance and cause a short squeeze, creating a big push in price to the upside.
Claim your Bitget sign-up bonuses here (details below).
Bullish BTC triangle with record stablecoin minting: A guide to Call Butterfly strategy: With Deribit’s Anand
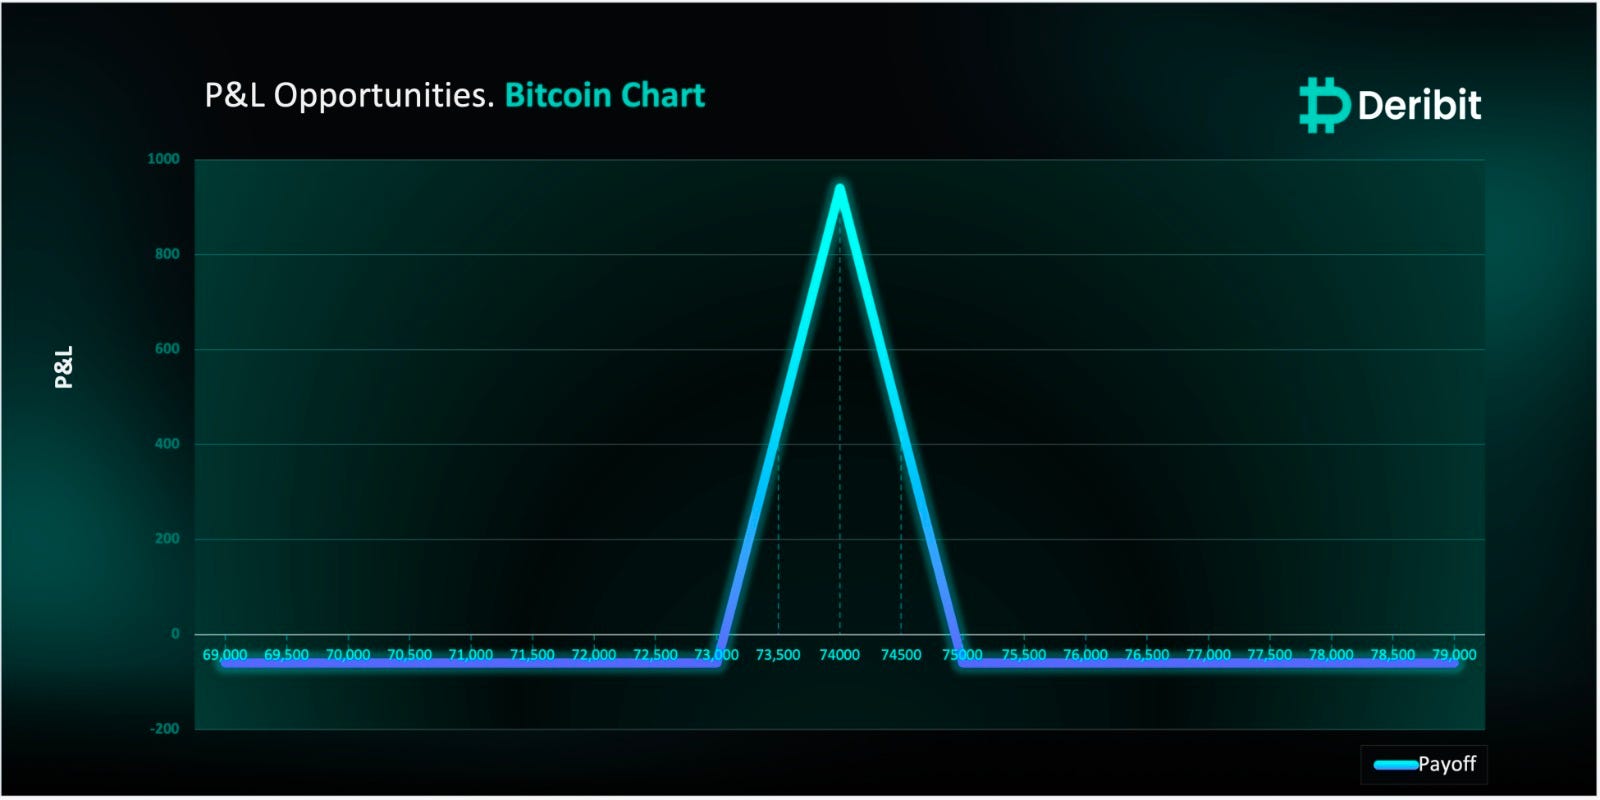
Bitcoin is currently adhering to a symmetrical triangle pattern on the 4H chart, and no significant retracements are observed when it touched the upper trend line, indicating a bullish environment. Additionally, examining stablecoin issuances which is a major driver for Crypto space, we’ve observed record minting, suggesting rapid movement of fiat money into crypto. Given these factors, there’s a possibility of BTC breaking-out from the symmetrical triangle pattern. Therefore, traders anticipating upward movement in the coming days may find the call butterfly strategy beneficial.
Trade Structure
(OTM Call) Buy 1x BTC-12APR24-$73,000-C @ $1020
(OTM Call) Sell 2x BTC-12APR24-$74,000-C @ $800
(OTM Call) Buy 1x BTC-12APR24-$75,000-C @ $640
Payouts
Maximum Profit: $940/BTC
Debit of Strategy: $60/BTC
If the Bitcoin price is at $74,000 when the options expire on April 12th, traders will achieve maximum profit from this strategy.
Create your Deribit account here.
Banter’s Take
Bitcoin is currently moving to retest previous highs. I expect the price to retest $73,000 this week. How it interacts with these levels will provide an indication of price expectations for the week.
If we consolidate above $72,000, we remain bullish and look towards higher levels. The big question then arises: Do we hold it as support?
If so, we are bullish, looking for continuation and a significant short squeeze. If not, we deviate back inside the range and need to identify the next target level. A deviation back inside the range puts $55,000 back on the table to fill the CME Gap and balance the charts for the next move.
Stay safe my friends!
Go to our Crypto Banter Discord here where Sheldon and Kyle give updates on the charts and trades from The Daily Candle newsletter!