

📈📉 Nvidia, PYR and AI Token Entries We Can’t Ignore!
📈📉 Nvidia, PYR and AI Token Entries We Can’t Ignore!

Overview
Chart #1 - Render (RNDRUSDT) Daily Chart
Chart #2 - Vulcan Forged (PYRUSDT) Daily Chart
Chart #3 - Nvidia (NVDA) Daily Chart
Chart #4 - Avalanche (AVAXUSDT) Daily Chart
Chart #5 - Fear and Greed Index

Chart #1 - Render (RNDRUSDT) Daily Chart
Chartist: Sheldon
(For the chart screenshot, click here.)
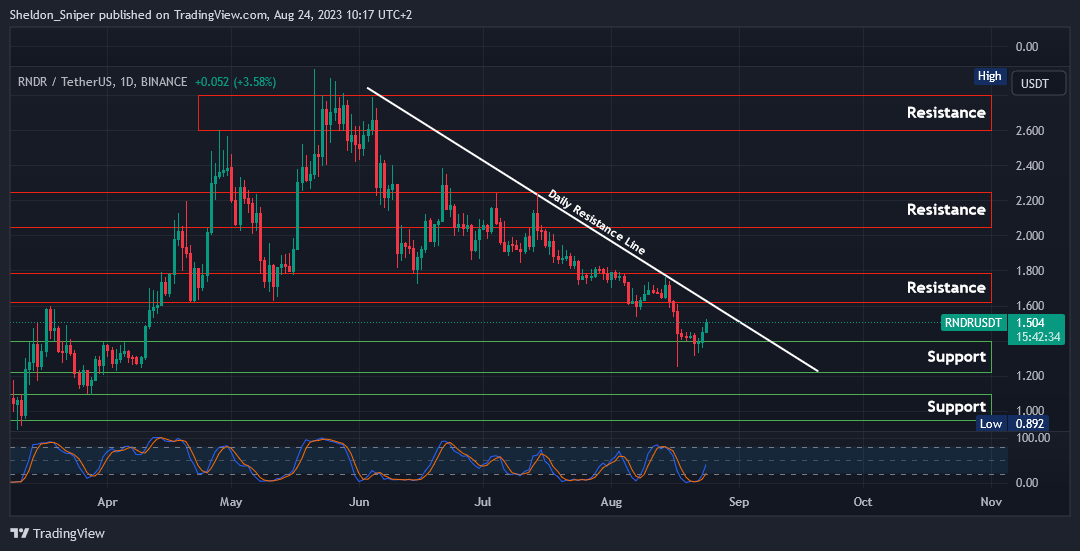
Over the past week, the $1.20 - $1.40 range has consistently served as support RNDR. With the current price standing at $1.50, there's approximately an 8% climb before reaching the subsequent resistance area of $1.60 - $1.80.
The descending daily resistance line, from early June, will likely add additional resistance within that range. If the price surpasses the $1.80 resistance, the next resistance zone lies between $2.00 - $2.20.
If the $1.20 support fails to hold, the following support area is around $0.95 - $1.10.
Sign-up and trade on Bybit today.
Exclusive $30,000 deposit rewards and bonuses up for grabs!
Chart #2 - Vulcan Forged (PYRUSDT) Daily Chart
Chartist: Kyle
(For the chart screenshot, click here.)
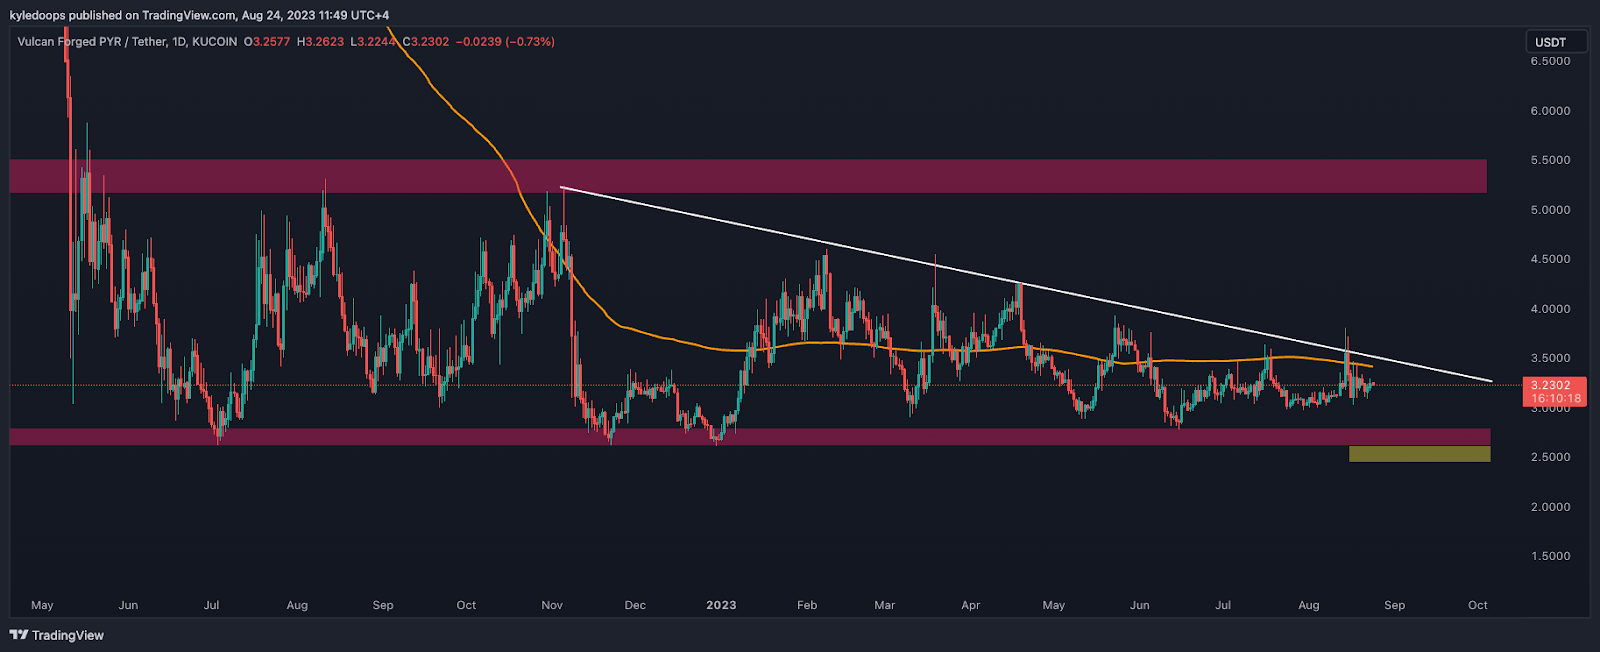
PYR has been in a very long time accumulation phase, with 3 lows having been put in at $2.62.
This level likely gets taken out in the future, which would be the ultimate entry.
As for how deep it goes, we can't be sure yet. But the wick that comes below that level is the longer-term entry point.
𝗣𝗿𝗶𝗺𝗲 𝗫𝗕𝗧
Sign up for a new Trading Account on Prime XBT!
Receive a deposit bonus of up to $7,000 with promo code: KyleDoops
Chart #3 - Nvidia (NVDA) Daily Chart
Chartist: Kyle
(For the chart screenshot, click here.)
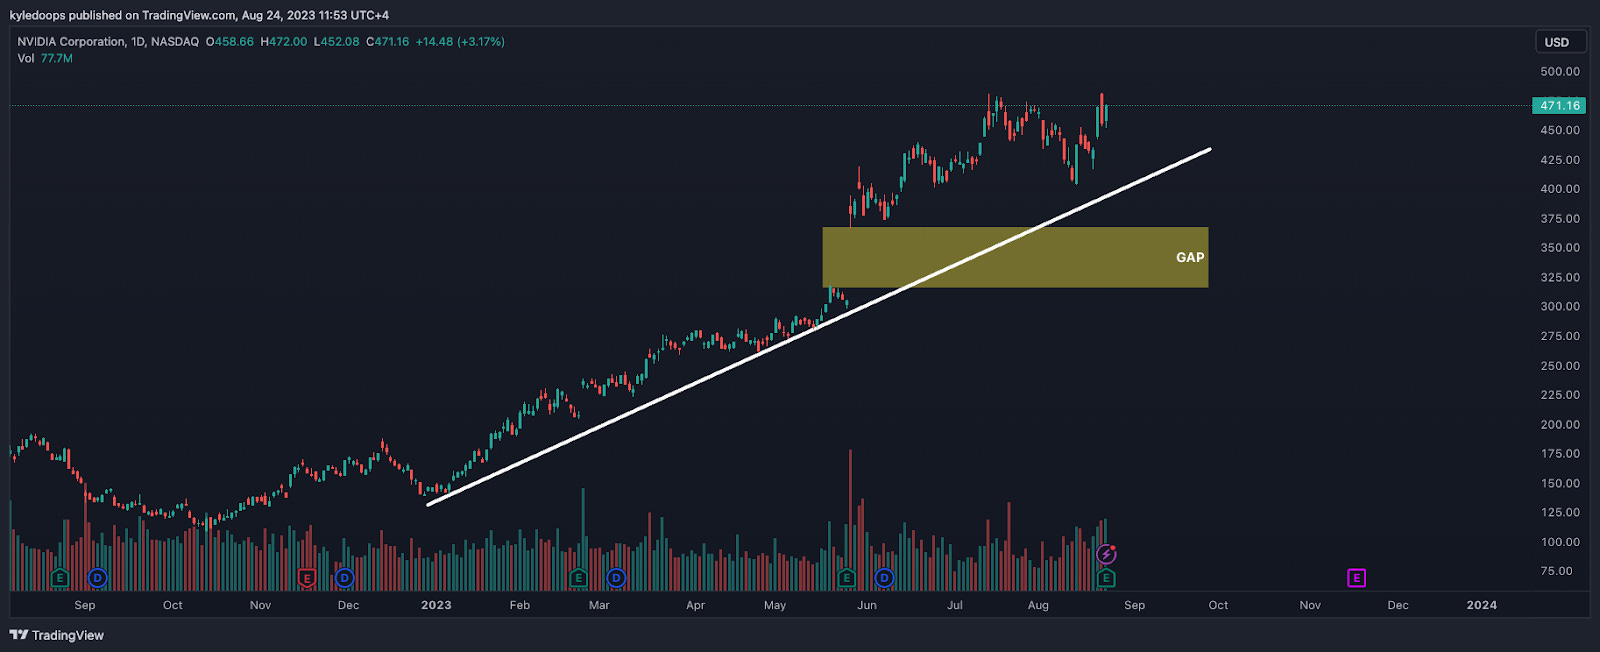
Nvidia beat earnings and is continuing its uptrend, holding the trend line. However, there's a gap below the price between $314 - $369.
Remember, gaps have a high probability of being filled in the future. This likely represents a potential "buy the dip" opportunity for us.
Claim your Bitget sign-up bonuses here (details below).
Chart #4 - Avalanche (AVAXUSDT) Daily Chart
Chartist: Sheldon
(For the chart screenshot, click here.)
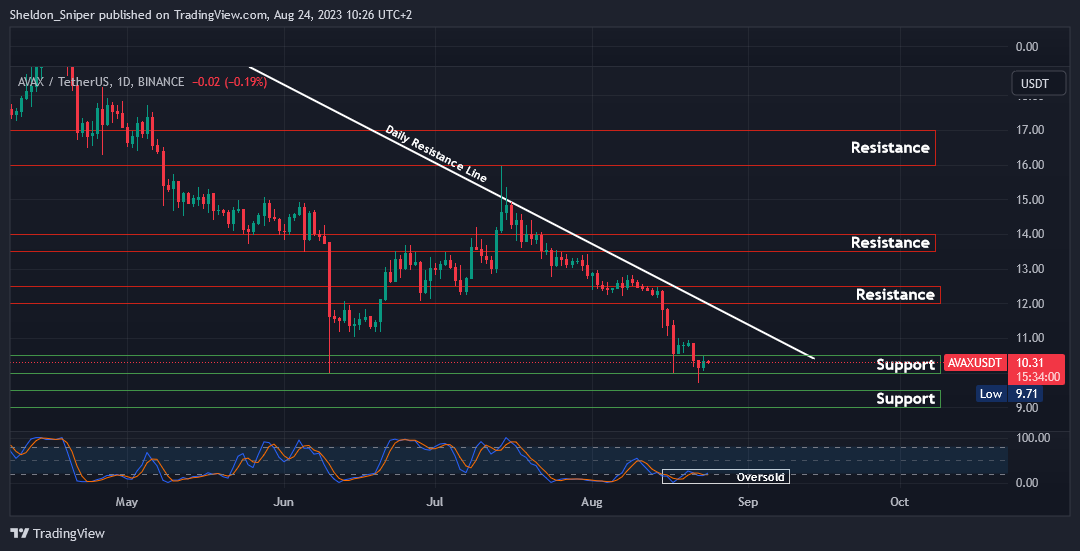
AVAX has experienced significant pressure over the past 4 - 5 months and is currently trading at levels last seen in June.
Four months ago, it was trading at over $21. Since then, it has declined to $10.30. The price appears to be oversold on the daily time frame and is trading within the $10.00 - $10.50 support range. If this support maintains, we might witness a potential relief bounce to the upcoming resistance level around $11.00. This higher range also intersects with the descending daily resistance line traced back to April.
Should the broader crypto market backtrack and AVAX's price dip below the $10.00 support, it could head to $9.00 - $9.50.
Claim your Bitget sign-up bonuses here (details below).
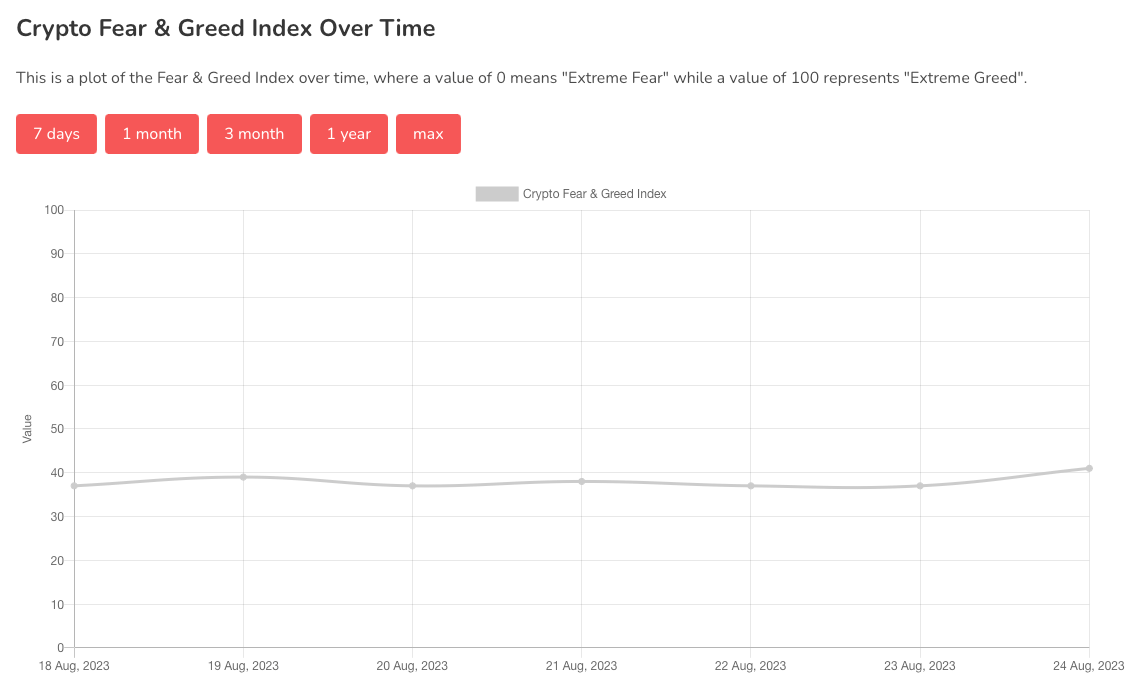
Chart #5 - Fear and Greed Index
The Fear and Greed Index is sitting at 41 today, indicating Fear.
The highest the index has been over the past seven days is 41, and the lowest is 37.
Banter’s Take
Given that Nvidia’s earnings performed well, the stock market is poised to continue its upward trajectory, which could bode well for Bitcoin and other cryptos. We’ll keep an eye on the AI tokens when Nvidia eventually retraces into that gap, as they often move in tandem. It could present a nice entry.
Stay safe my friends!
Go to our Crypto Banter Discord here where Sheldon and Kyle give updates on the charts and trades from The Daily Candle newsletter!