

📈 Oil to $100? BTC Faces Liquidation Zone!
📈 Oil to $100? BTC Faces Liquidation Zone!
The likelihood of another interest rate hike has already increased!
Overview
Chart #1 - Ethereum (ETHUSDT) Daily
Chart #2 - Bitcoin (BTCUSD) 4-Hour
Chart #3 - Crude Oil (WTI) Daily
Chart #4 - Avalanche (AVAXUSDT) Daily
Chart #5 - Fear and Greed Index

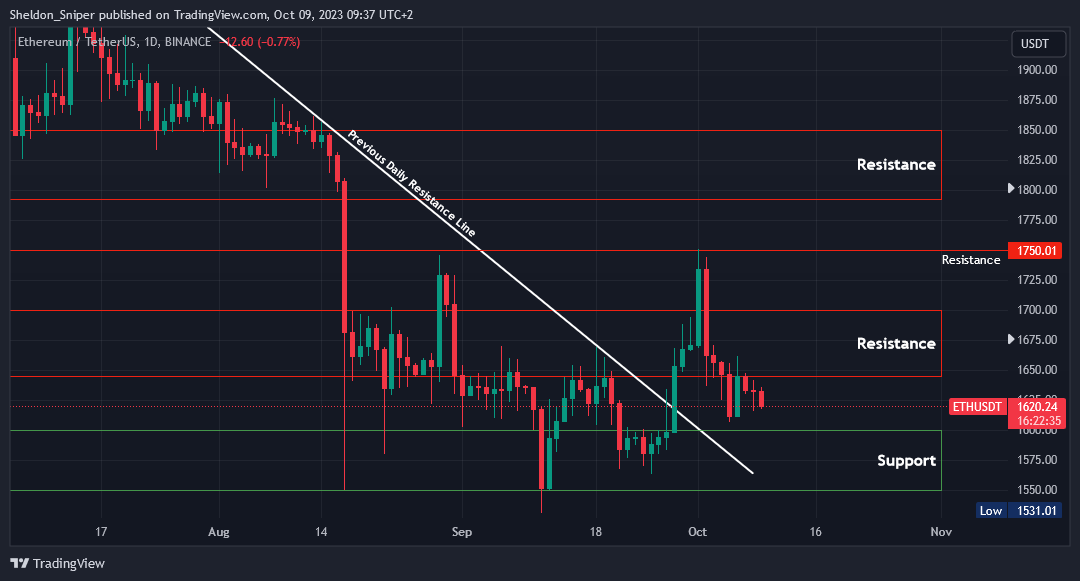
Chart #1 - Ethereum (ETHUSDT) Daily
Chartist: Sheldon
(For the chart screenshot, click here.)
On Friday, ETH was rejected at $1,650 and has slowly retraced to $1,620. The news over the weekend of the outbreak of war in Israel spooked the stock markets early Monday morning, affecting crypto along the way.
The next level of support is at the top of the range, $1,600, extending down to $1,550.
The descending support line, which was broken towards the end of September, will now also act as additional support. A retrace to this next support area could provide another opportunity for a long trade on ETH.
Sign-up and trade on Bybit today.
Exclusive $30,000 deposit rewards and bonuses up for grabs!
Chart #2 - Bitcoin (BTCUSD) 4-Hour
Chartist: Kyle

(For the chart screenshot, click here.)
Bitcoin is currently pulling back and is likely to find support at the 200 EMA on the 4-hour chart, which aligns with the upward-sloping trend line.
If it fails to hold this level, it's probably only temporary, as there's a liquidation zone at $26,900 that would likely be reached.
For now, the golden cross remains intact with the 50 EMA above the 200 EMA, and dips should encounter support.
Claim your Bitget sign-up bonuses here (details below).
Chart #3 - Crude Oil (WTI) Daily
Chartist: Kyle

(For the chart screenshot, click here.)
Oil has gapped up and is likely starting to run back up to $100 per barrel.
It has created a higher low and may be beginning a trend continuation due to the geopolitical instability between Israel and Hamas.
This is typically detrimental for inflation, suggesting inflation will continue to rise.
Claim your Bitget sign-up bonuses here (details below).
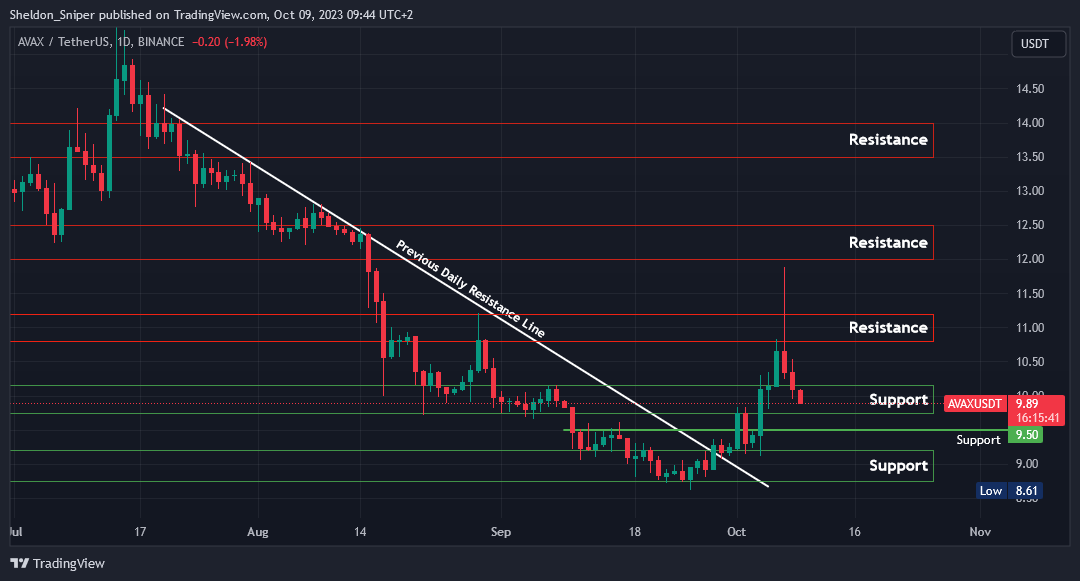
Chart #4 - Avalanche (AVAXUSDT) Daily
Chartist: Sheldo
(For the chart screenshot, click here.)
AVAX is now within the $9.70 - $10.20 support area.
If it stabilizes and maintains this support, it could be setting up for another upward move and a potential long trade in the coming days.
If the $9.70 level doesn't hold as support, the next support is at $9.50, with a major support area below that at $8.75 - $9.25.
Claim your Bitget sign-up bonuses here (details below).
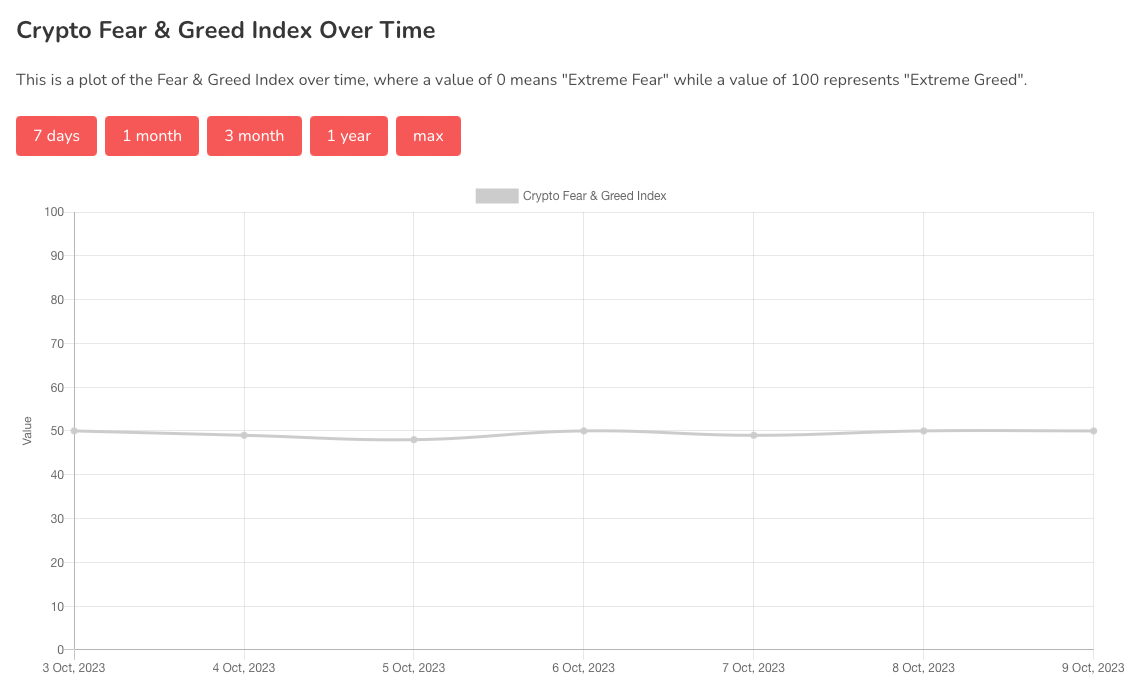
Chart #5 - Fear and Greed Index
The Fear and Greed Index is sitting at 50 today, Neutral.
The highest the index has been over the past seven days is 50, and the lowest is 48.
Banter’s Take
Higher oil prices mean higher inflation. This week, the FED will address inflation. The likelihood of another interest rate hike has already increased.
We’ll trade the chart in front of us. If Bitcoin is in an uptrend, we’ll stick with that uptrend until it fails.
Stay safe my friends!
Go to our Crypto Banter Discord here where Sheldon and Kyle give updates on the charts and trades from The Daily Candle newsletter!