

📈📉 On the verge of extreme greed! But bitcoin must not lose this level!
📈📉 On the verge of extreme greed! But bitcoin must not lose this level!

Bitget winner - 2400175515
Chart #1 - TOTAL 12-Hour Chart
Chartist: Sheldon

(For the chart screenshot, click here.)
Yesterday, as bitcoin hit $28,500, the TOTAL reached $1.16T, heading straight into resistance where it got rejected last August. Now everyone is wondering if it will get rejected here again.
On its higher time frames, the TOTAL is overbought, so, if rejected, it could head to last month's high of $1.095T, but more critical support lies between $1.03T- $1.05T.
It's important to understand that throughout 2021 and 2022 the $1.16T - $1.2T area held as crucial support, so now it will be hard resistance to flip from the underside.
𝗣𝗿𝗶𝗺𝗲 𝗫𝗕𝗧
Sign up for a new Trading Account on Prime XBT!
Receive a deposit bonus of up to $7,000 with promo code: SheldonSniper
Chart #2 - DXY 8-Hour Chart
Chartist: Kyle
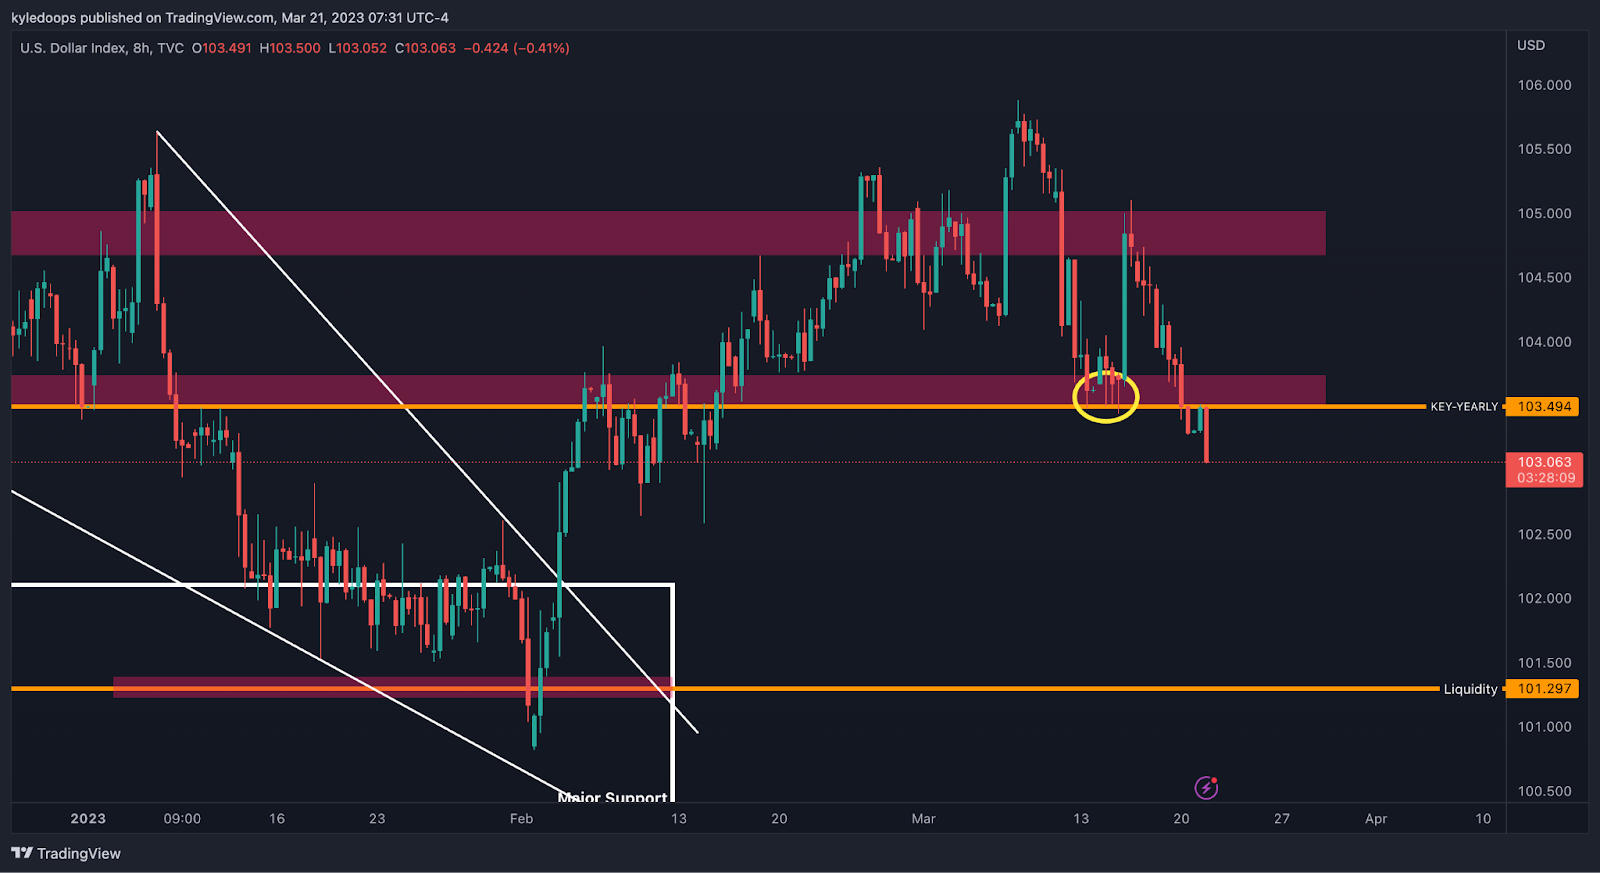
(For the chart screenshot, click here.)
The dollar is showing extreme weakness and has lost a key yearly level, which means potential downside for the USD and an upwards move for risk-on assets.
Until such time as the dollar bounces, bitcoin could push up to the $30,000 level. Combine that with what follows in the BTC chart.
𝗣𝗿𝗶𝗺𝗲 𝗫𝗕𝗧
Sign up for a new Trading Account on Prime XBT!
Receive a deposit bonus of up to $7,000 with promo code: KyleDoops
Chart #3 - Bitcoin (BTCUSDT) 1-Hour Chart
Chartist: Kyle
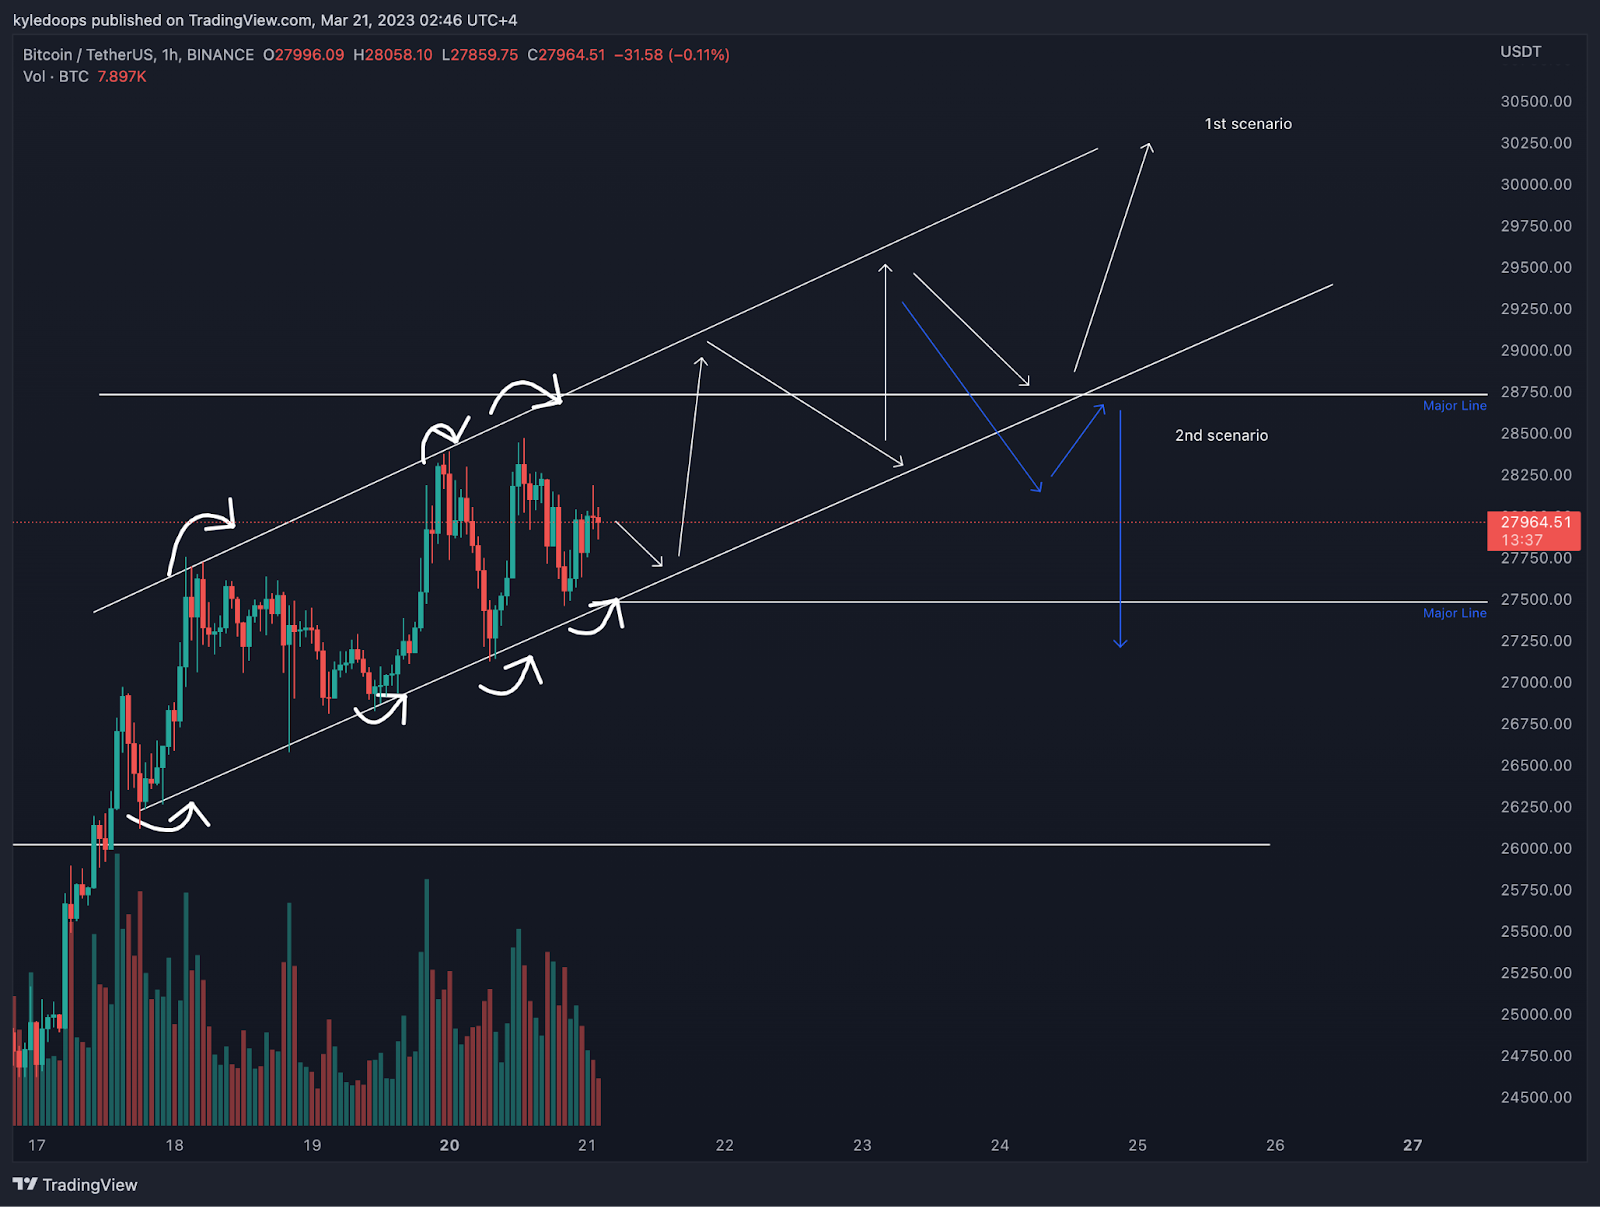
(For the chart screenshot, click here.)
I have outlined two possible scenarios for bitcoin in the chart.
For now, it is respecting a beautiful uptrend and forming higher highs and higher lows. So it's best to respect that trend until it shows signs of weakness.
Speaking of which, bitcoin will hint at possible weakness if it reaches the $28,700 - $29,000 area and gets rejected or if it breaks its up trend.
Claim your Bitget sign-up bonuses here (details below).
Chart #4 - Bitcoin Dominance (BTC.D) 3-Day Chart
Chartist: Sheldon
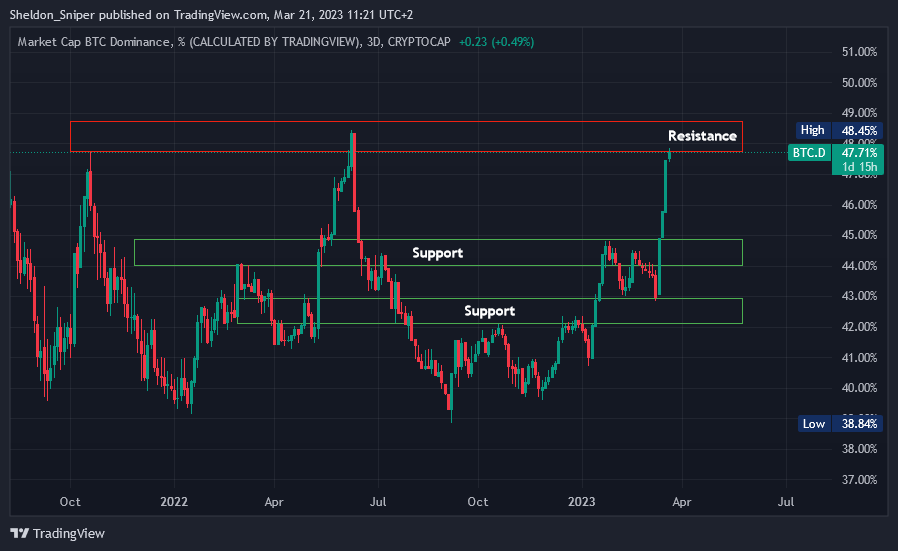
(For the chart screenshot, click here.)
For most of 2023 so far, Bitcoin Dominance has been trending upwards but now may have reached a roadblock, preventing it from going any higher.
It is currently at 48% from where it has been rejected twice in the last two years.
There is a chance that BTC.D drops and reaches support at 45%, or maybe even lower at 43%, which will definitely make the altcoins fly.
Claim your Bitget sign-up bonuses here (details below).
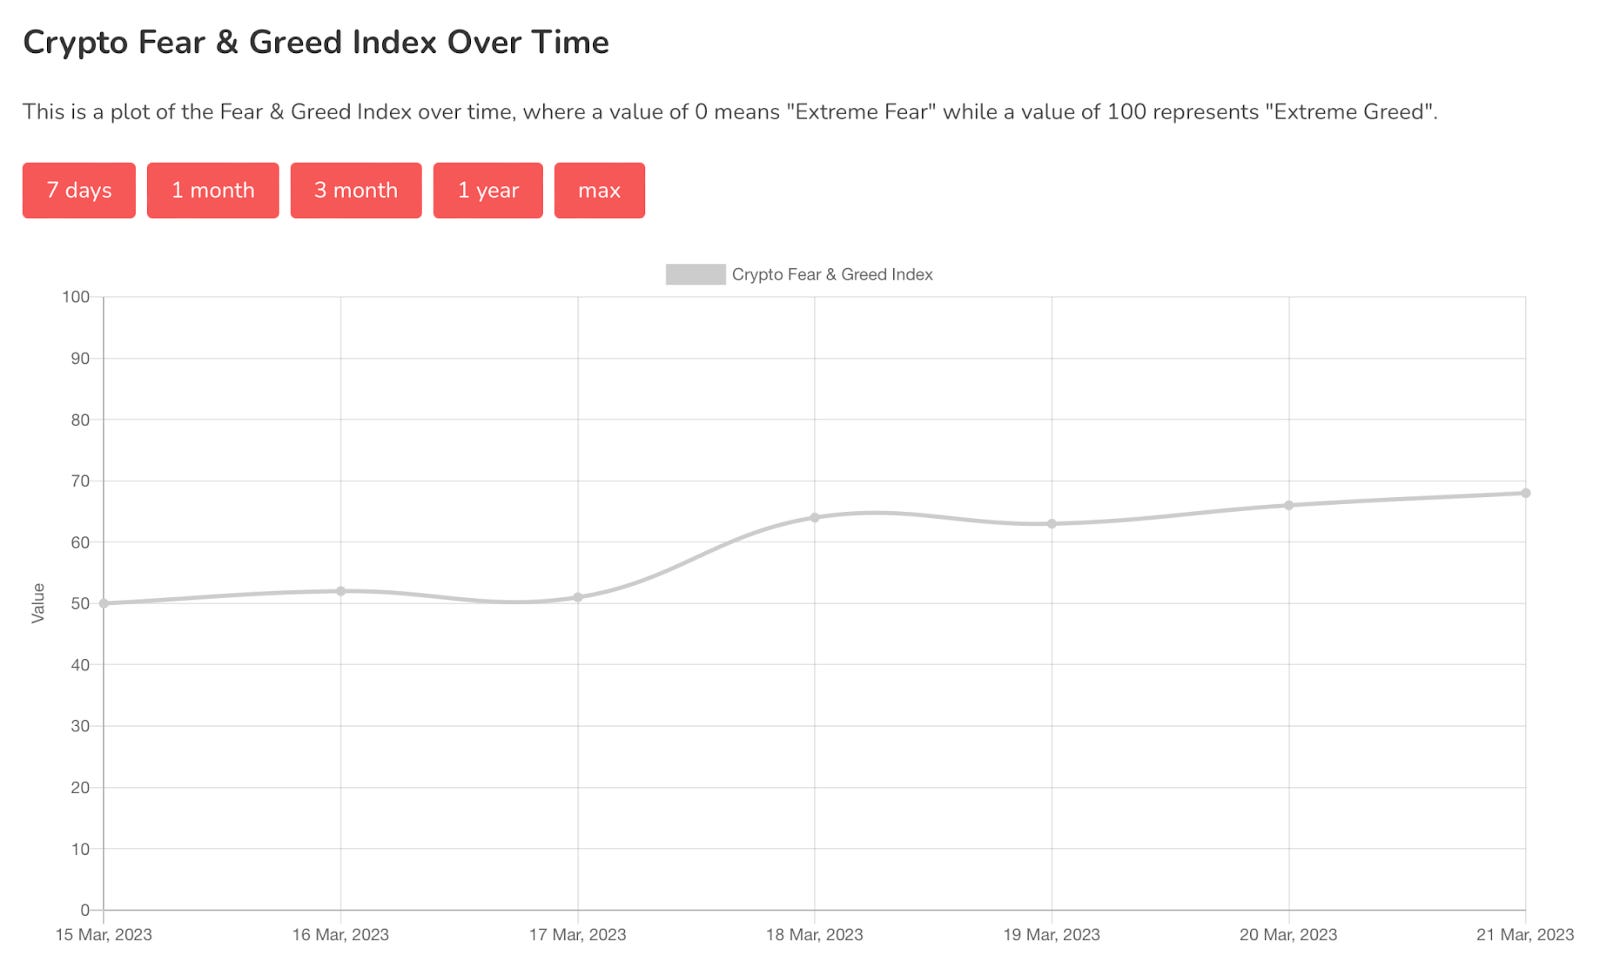
Chart #5 - Bitcoin Fear and Greed Index
The Bitcoin Fear and Greed Index is sitting at 68 today, indicating Greed.
The highest the index has been over the past seven days is 68, and the lowest is 50.
Overall Market Sentiment (Banter’s Take)
The trend is your friend until the end of the trend, and crypto could still push a little higher. However, expect a pullback sometime this week. We could see one when the FOMC takes place. Market participants will be profit taking into that event.
Stay safe my friends!
Go to our Crypto Banter Discord here where Sheldon and Kyle give updates on the charts and trades from The Daily Candle newsletter!
Bybit winner - 2742424