

📈📉 Optimism and Render Priming Up! Can the TOTAL2 Hold?
📈📉 Optimism and Render Priming Up! Can the TOTAL2 Hold?

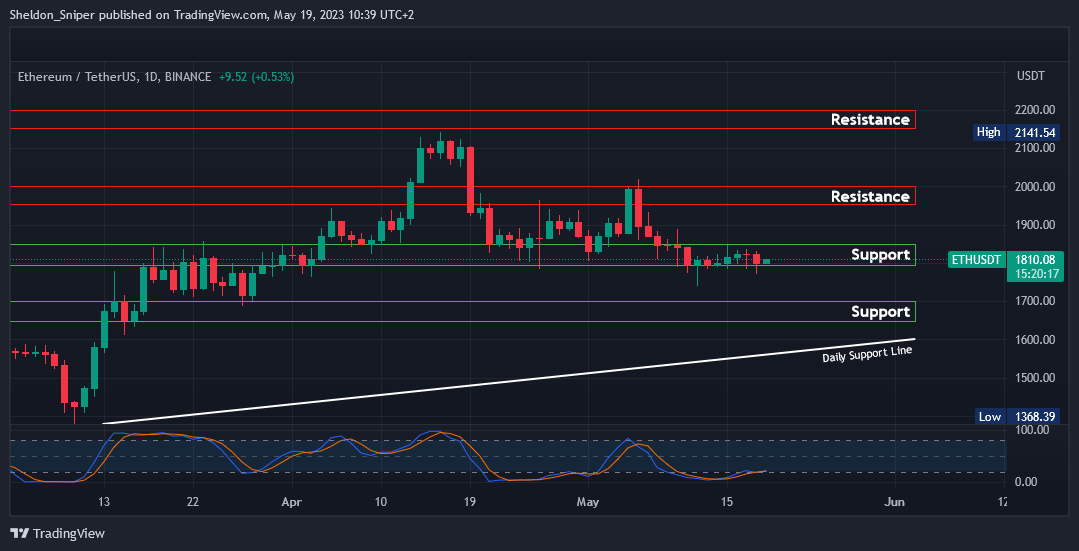
Chart #1 - Ethereum (ETHUSDT) 1-Day Chart
Chartist: Sheldon
(For the chart screenshot, click here.)
In the past week, ETH has been steady in the $1,800 - $1,850 support zone. Given that the long-term Stochastic RSI is oversold, there's a possibility that ETH is preparing for an upward trend. The next resistance levels to look out for would be $1,900, and potentially even the major $1,950 - $2,000 resistance area.
However, should ETH break below the current $1,800 support level, it could trigger a fall towards the next support zone between $1,650 and $1,700. Just beneath that level, the Daily Ascending Support line, which originated in December of the previous year, is situated around $1,600. This could be another crucial support point to watch.
𝗣𝗿𝗶𝗺𝗲 𝗫𝗕𝗧
Sign up for a new Trading Account on Prime XBT!
Receive a deposit bonus of up to $7,000 with promo code: SheldonSniper
Chart #2 - Optimism (OPUSDT) 1-Day Chart
Chartist: Kyle

(For the chart screenshot, click here.)
OP coin is certainly one to watch. It recently experienced a rejection from the 200-day exponential moving average (EMA). If it continues its current pattern of distribution and consolidation, pulling back towards the $1.50 - $1.65 range, this could allow the daily EMAs to begin flattening.
The daily Relative Strength Index (RSI) has also nicely reset, and volume has started to flow back into OP. All these factors could allow OP to retrace towards the monthly open of around $2.10 - $2.15, if not slightly higher.
However, do keep an eye on the blue trend line. It's important that OP does not drop below this line.
𝗣𝗿𝗶𝗺𝗲 𝗫𝗕𝗧
Sign up for a new Trading Account on Prime XBT!
Receive a deposit bonus of up to $7,000 with promo code: KyleDoops

Chart #3 - Render (RNDRUSDT) 1-Day Chart
Chartist: Kyle

(For the chart screenshot, click here.)
RNDR is another coin to monitor closely in the upcoming days.
At the moment, it has fully retraced to the monthly open but has failed to surpass previous highs or close any daily candles above the monthly high.
However, the overall sentiment towards AI remains strong, which could be good for RNDR. I anticipate a pullback towards the $2.03 - $2.08 range, and from there, a potential upward movement towards higher levels.
Claim your Bitget sign-up bonuses here (details below).
Chart #4 - TOTAL2 1-Day Chart
Chartist: Sheldon

(For the chart screenshot, click here.)
Over the past week, the TOTAL2 has stabilized within the $560 billion to $575 billion support range and is now oversold on longer time frames.
If it can break through the $575 billion mark and trend upward, it might revisit the $600 billion resistance level. But a drop below the $560 billion support level could be problematic, with the next support level found at the bottom of the current range, around $535 billion.
Historically, May and June have not been particularly robust months for crypto trading. As such, we might see the market continue to fluctuate within this range, or even potentially decline further in the coming weeks.
Claim your Bitget sign-up bonuses here (details below).
Chart #5 - Bitcoin Fear and Greed Index
The Bitcoin Fear and Greed Index is sitting at 48 today, Neutral.
The highest the index has been over the past seven days is 54, and the lowest is 48.

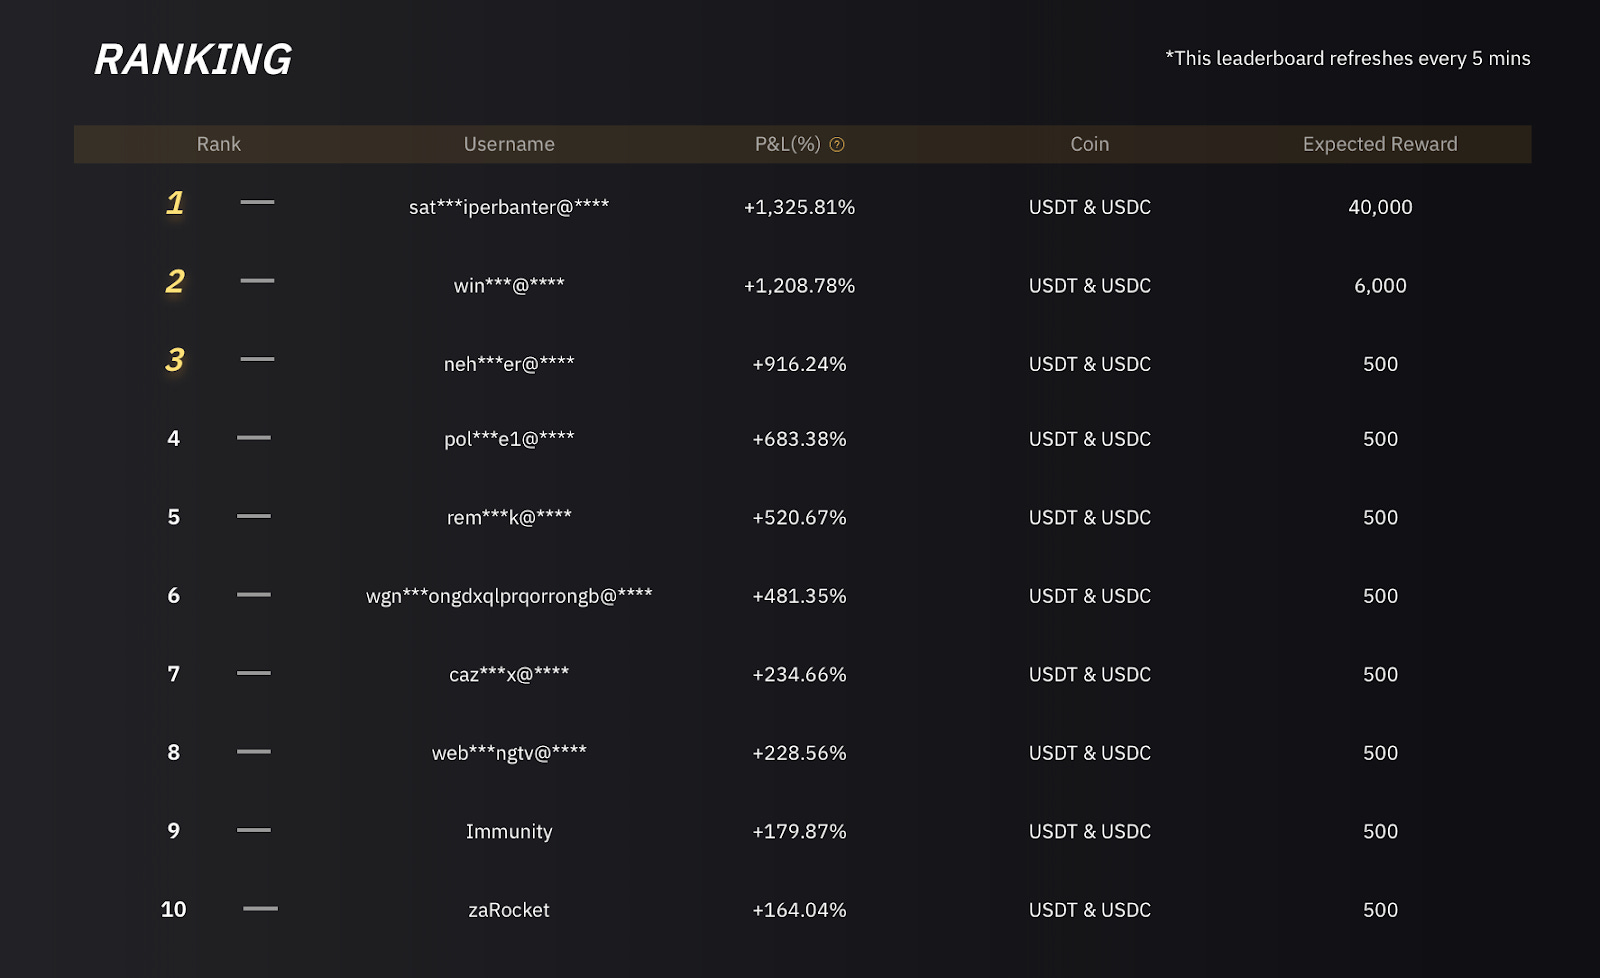
Competition Leaderboard
Banter’s Take
Historically, May has been a challenging month for the crypto market.
The current market is continuing to consolidate within a narrow range, a trend which may persist for the next few weeks. There's even a possibility of further declines. Given these conditions, it's crucial for traders to manage their risk effectively during this period.
Stay safe my friends!
Go to our Crypto Banter Discord here where Sheldon and Kyle give updates on the charts and trades from The Daily Candle newsletter!