

📈📉 Our Entry Levels for ETH and SOL are…
📈📉 Our Entry Levels for ETH and SOL are…

Chart #1 - Ethereum (ETHUSDT) 1-Week Chart
Chartist: Sheldon

(For the chart screenshot, click here.)
Despite the aggressive dumps on altcoins, ETH has demonstrated relative resilience. Remember, when in doubt, zoom out.
As you can see, ETH remains comfortably above the weekly trend line, established in November of last year. Currently, it's within the lower range of a falling wedge - a bullish candlestick pattern. Historically, this pattern has a 68% chance of leading to an upward break.
Furthermore, ETH has found support on the 0.382 retracement line, traced from the low point on November 22 to the interim high on May 23. Traditionally, this is a very bullish level to maintain.
Entering long positions within the green support box offers an attractive entry point for the long term, with a stop loss just below the wick low of $1,688.
Bybit
Sign-up and trade on Bybit today.
Exclusive $30,000 deposit rewards and bonuses up for grabs!
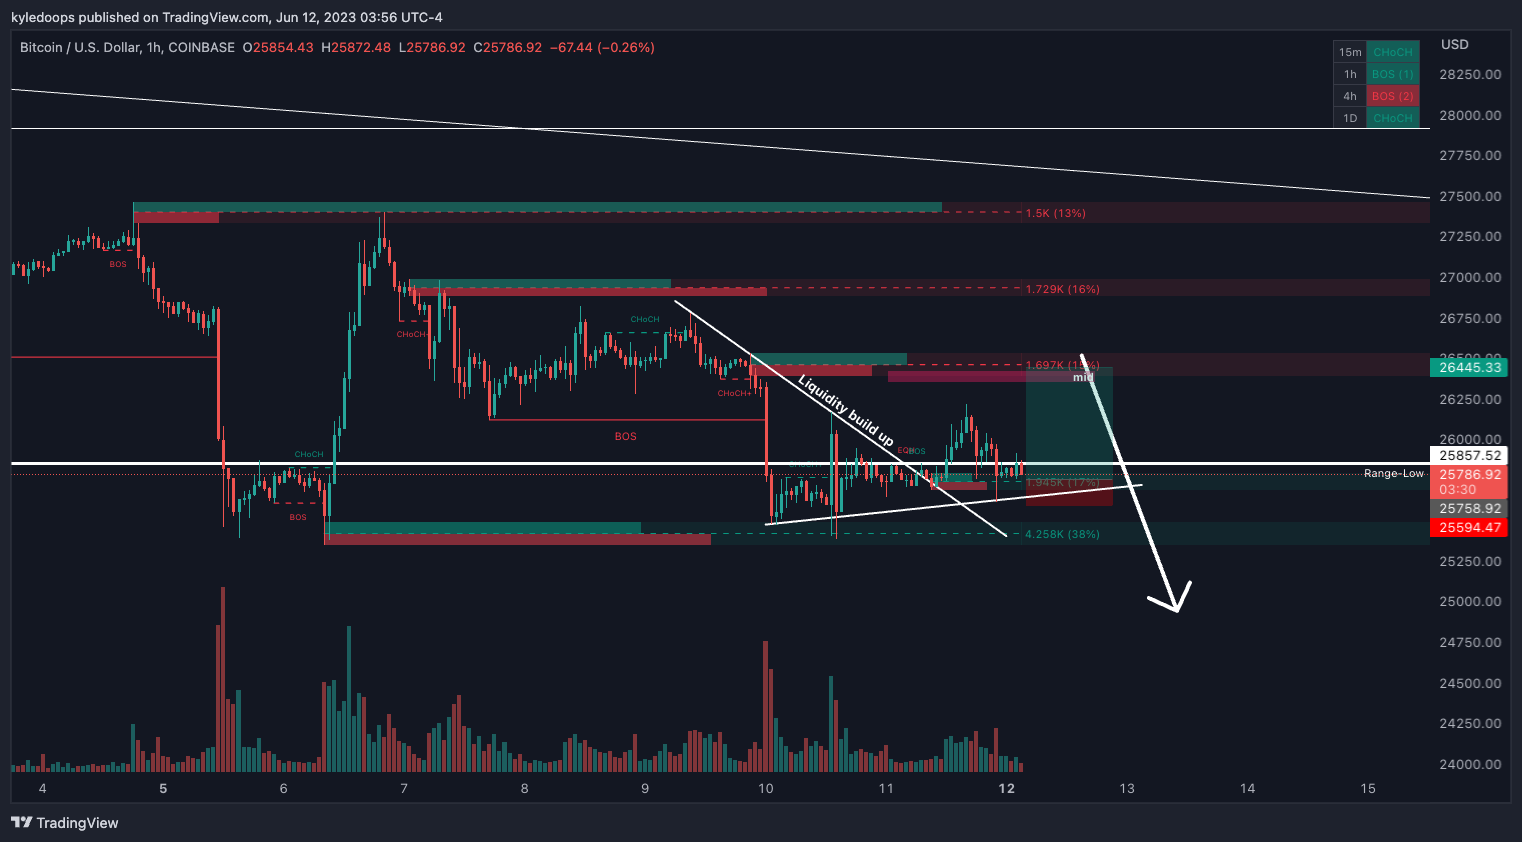
Chart #2 - Bitcoin (BTCUSD) 1-Hour Chart
Chartist: Kyle
(For the chart screenshot, click here.)
Bitcoin is currently trading within a tight range between $25,300 and $27,480.
I anticipate the price pushing up to the mid-range point of $26,445. However, following this, it is likely to drop again, based on the fact that many traders have taken short positions.
Those who entered these late short positions are unlikely to enjoy a smooth downward trajectory without first being tested or stopped out.
𝗣𝗿𝗶𝗺𝗲 𝗫𝗕𝗧
Sign up for a new Trading Account on Prime XBT!
Receive a deposit bonus of up to $7,000 with promo code: KyleDoops

Sign up for a new Trading Account on Prime XBT!
Receive a deposit bonus of up to $7,000 with promo code: SheldonSniper
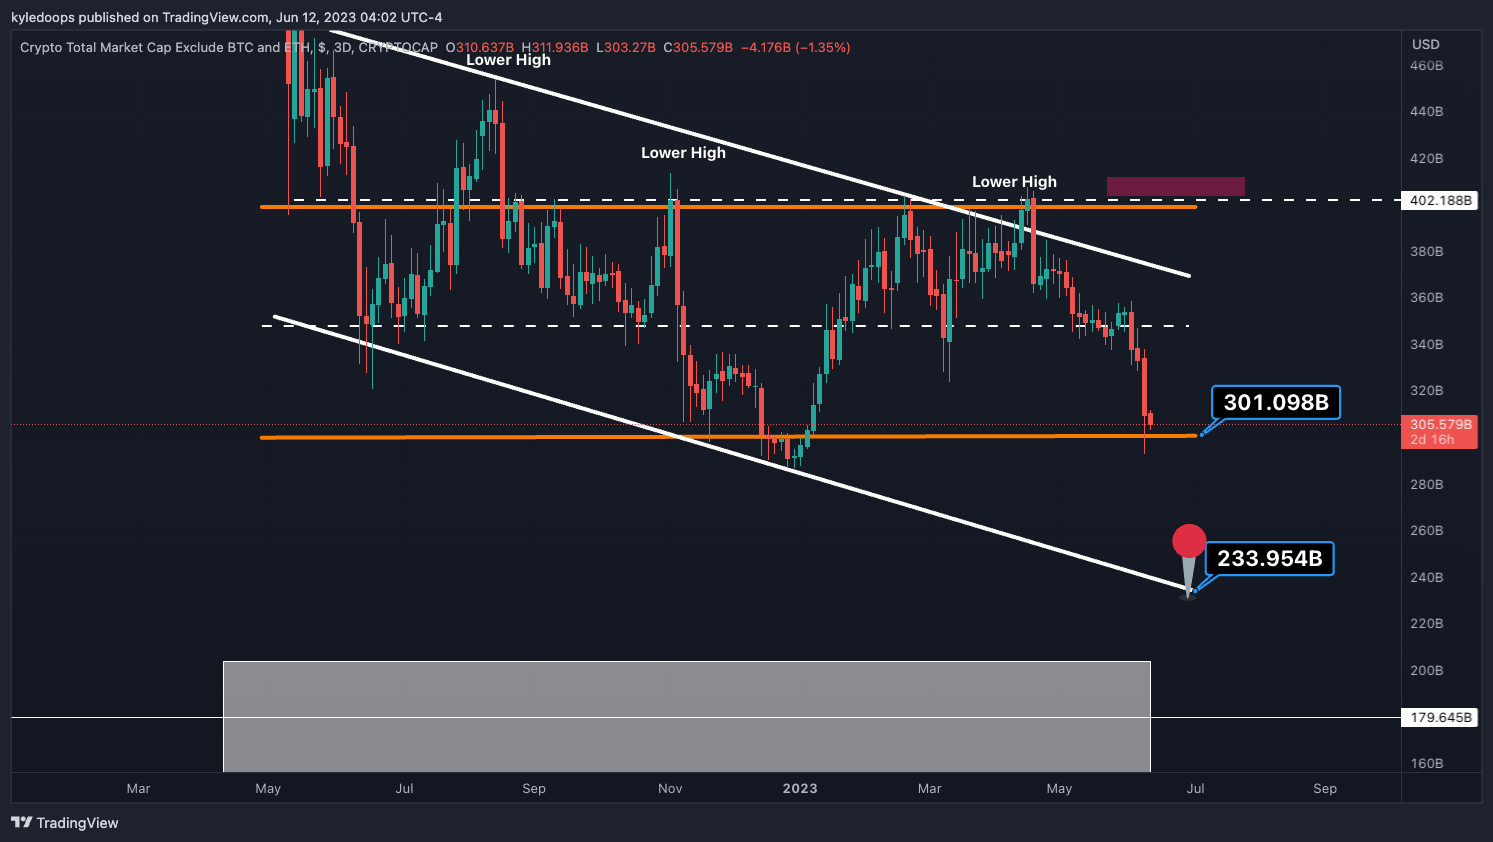
Chart #3 - TOTAL3 3-Day Chart
Chartist: Kyle
(For the chart screenshot, click here.)
If the total altcoin market excluding ETH (TOTAL3) doesn't rebound from its current position at $301 billion, it may revisit the $233.95 billion mark, which represents a further 25% decline from here.
Judging by the state of many altcoins, some of which have hit new lows, there's a real possibility that the rest of the altcoin index might follow this downward trajectory.
Claim your Bitget sign-up bonuses here (details below).
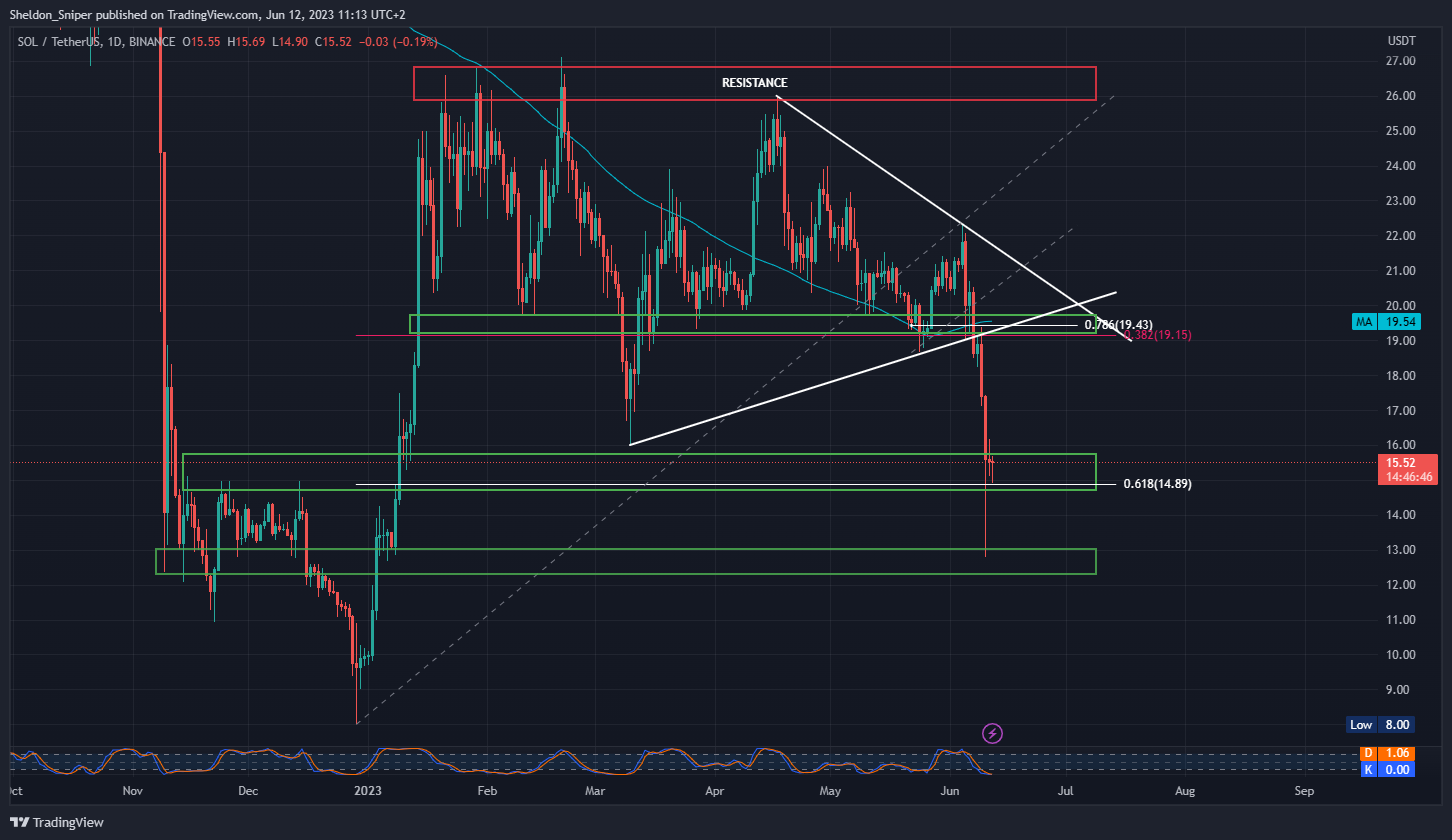
Chart #4 - Solana (SOLUSDT) 1-Day Chart
Chartist: Sheldon
(For the chart screenshot, click here.)
SOL is one of the alts that has seen significant volatility over the past year, particularly last Friday night when it was highlighted as a potential security token by the SEC.
Despite this, we remain very bullish on Solana's technology as a future-oriented protocol.
The Friday night crash took SOL down to a low of approximately $12.90, the lower support region. However, it quickly rebounded to the higher support area and the crucial 0.618 retracement level, measured from the low on December 22 to the high on February 23.
A spot-long entry today, with a stop loss set below the 0.618 retracement line at $14.89, could offer a favorable entry point.
Claim your Bitget sign-up bonuses here (details below).
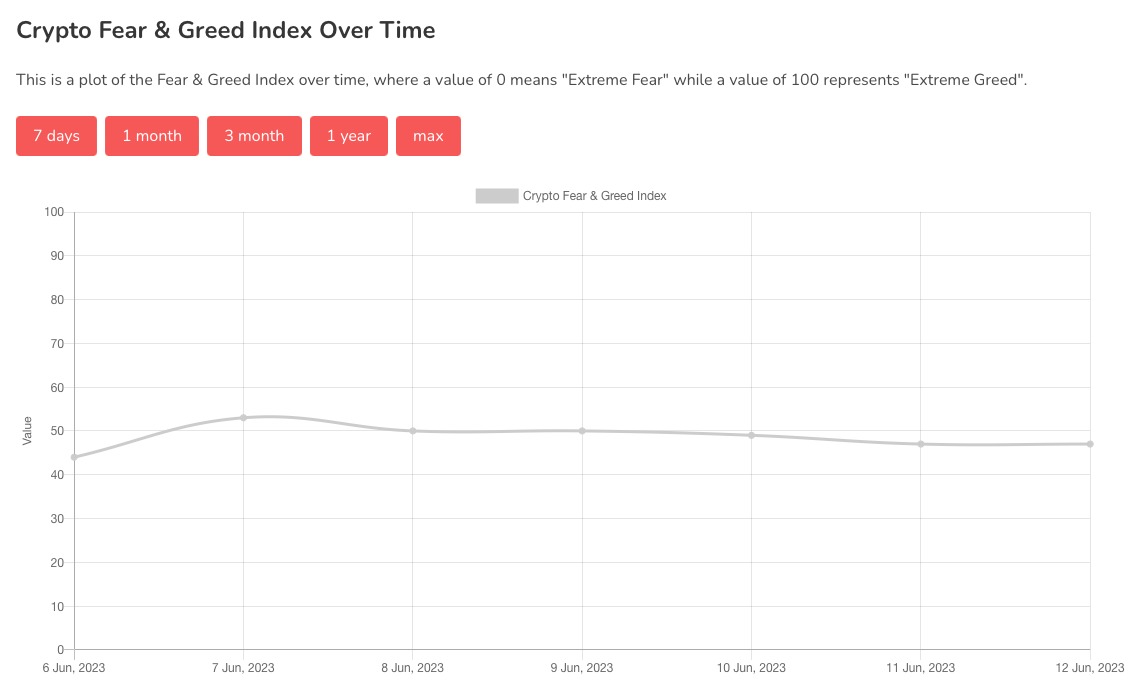
Chart #5 - Bitcoin Fear and Greed Index
The Bitcoin Fear and Greed Index is sitting at 47 today, Neutral.
The highest the index has been over the past seven days is 53, and the lowest is 44.
Banter’s Take
Small bounces from here could get faded for a final leg down. Use the 200 day moving average as your barometer on bitcoin and ETH. Above is good. Below is bad.
Stay safe my friends!
Go to our Crypto Banter Discord here where Sheldon and Kyle give updates on the charts and trades from The Daily Candle newsletter!