

📈📉 Our LINK Long Trade Pays Off! $18.32 NEXT?
📈📉 Our LINK Long Trade Pays Off! $18.32 NEXT?
PLUS: THIS Bitcoin Level NEEDS to HOLD!
Overview
Chart #1 - Bitcoin Dominance (BTC.D) Weekly
Chart #2 - Chainlink (LINKUSD) Daily
Chart #3 - Frax Share (FXSUSDT) Daily
Chart #4 - The Sandbox (SANDUSDT) Daily
Chart #5 - Fear and Greed Index
Chart #1 - Bitcoin Dominance (BTC.D) Weekly
Chartist: Sheldon
(For the chart screenshot, click here.)
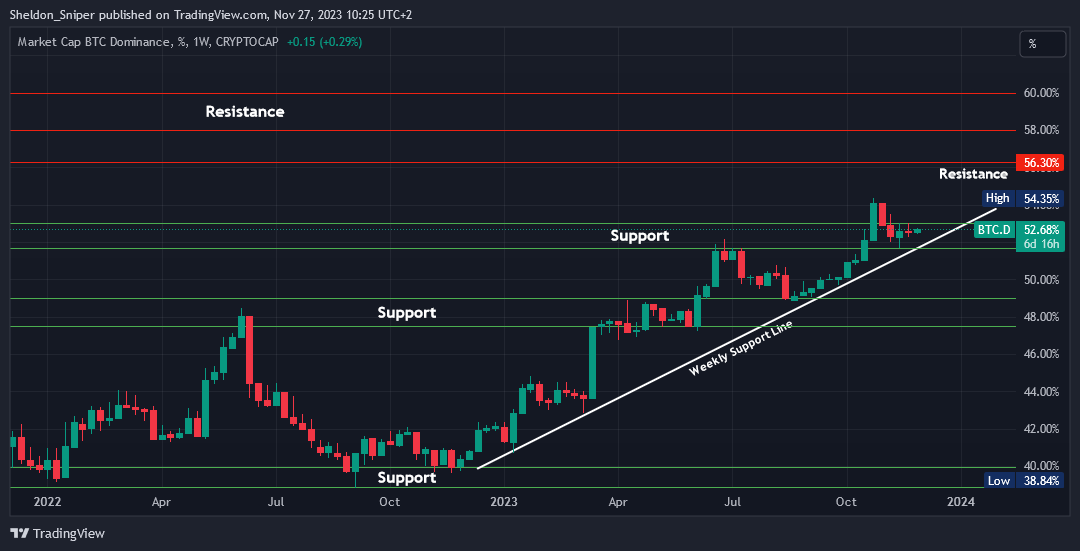
BTC.D is getting close to the weekly support line that started at the beginning of the year - there could be a retest by the end of this year.
If support holds, and the 53% level is broken, BTC.D could head to 56.30%.
However, if both the 52% and the weekly support line are broken, the next level of support is at 49%.
Sign-up and trade on Bybit today.
Exclusive $30,000 deposit rewards and bonuses up for grabs!
Chart #2 - Chainlink (LINKUSD) Daily
Chartist: Kyle
(For the chart screenshot, click here.)
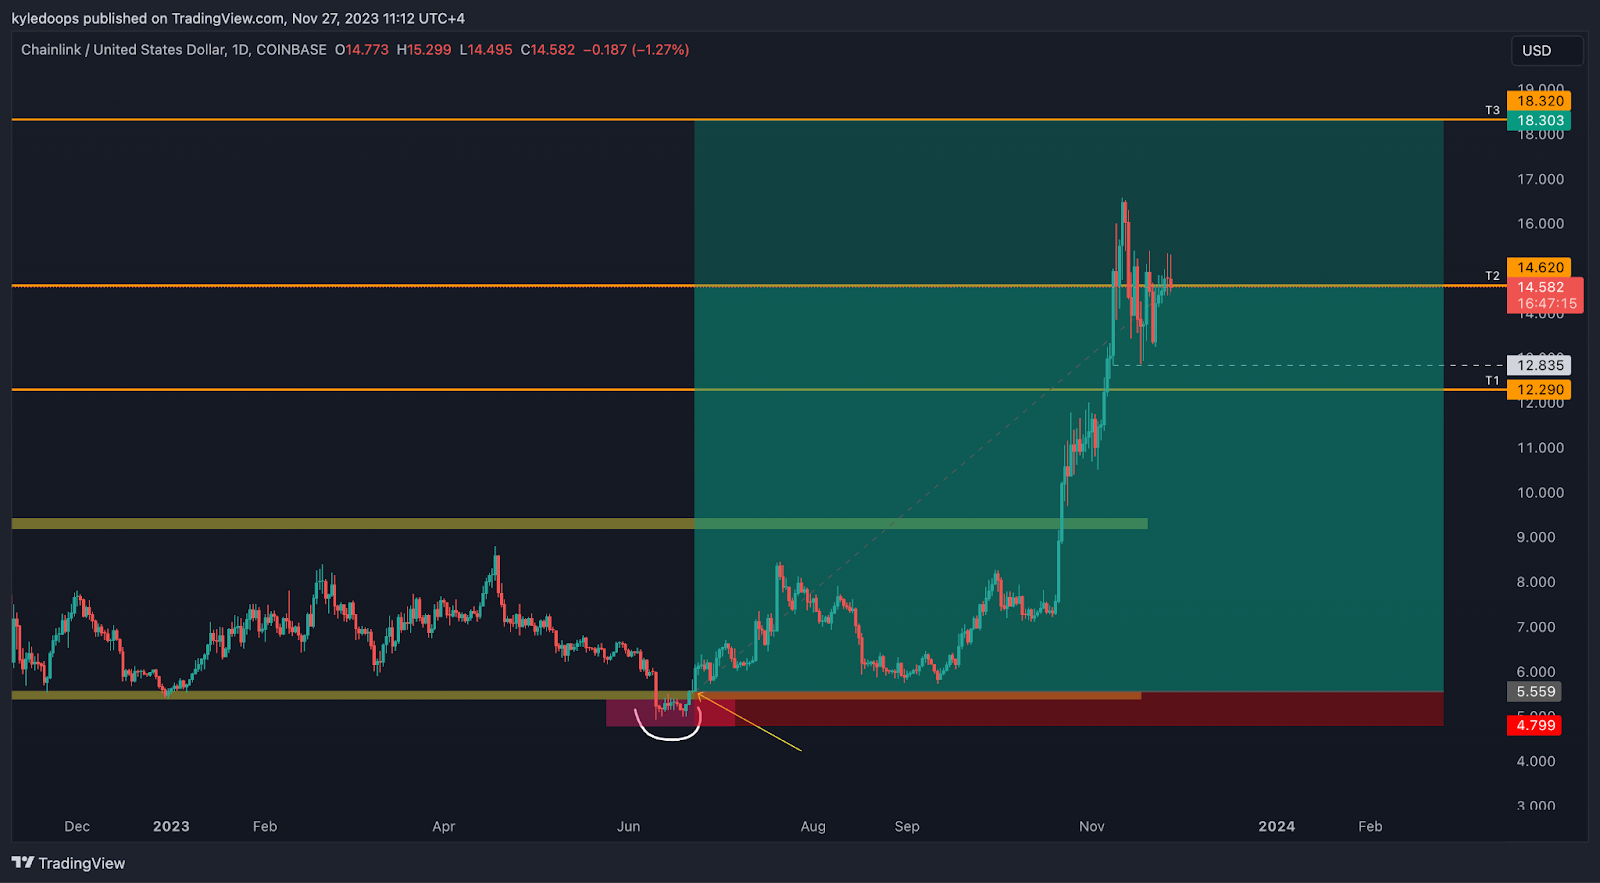
LINK has hit our Take Profits 2 level (TP2) and is consolidating!
It may form a range between $12 and $17 before breaking out at a later stage to target TP3, which is at $18.32.
Once we get that breakout and the target is met, we will close out the rest of our LINK positions and look to enter on the next major pullback.
Claim your Bitget sign-up bonuses here (details below).

Outsmart 99% Of The Market!
Get full access into our Discord And Telegram group, where you'll find all of our premium content!
👉 Trade Signals!
👉 Trade Set-Ups!
👉 Trading Challenges!
👉 Education!
👉 SO MUCH MORE!
Chart #3 - Frax Share (FXSUSDT) Daily
Chartist: Kyle
(For the chart screenshot, click here.)
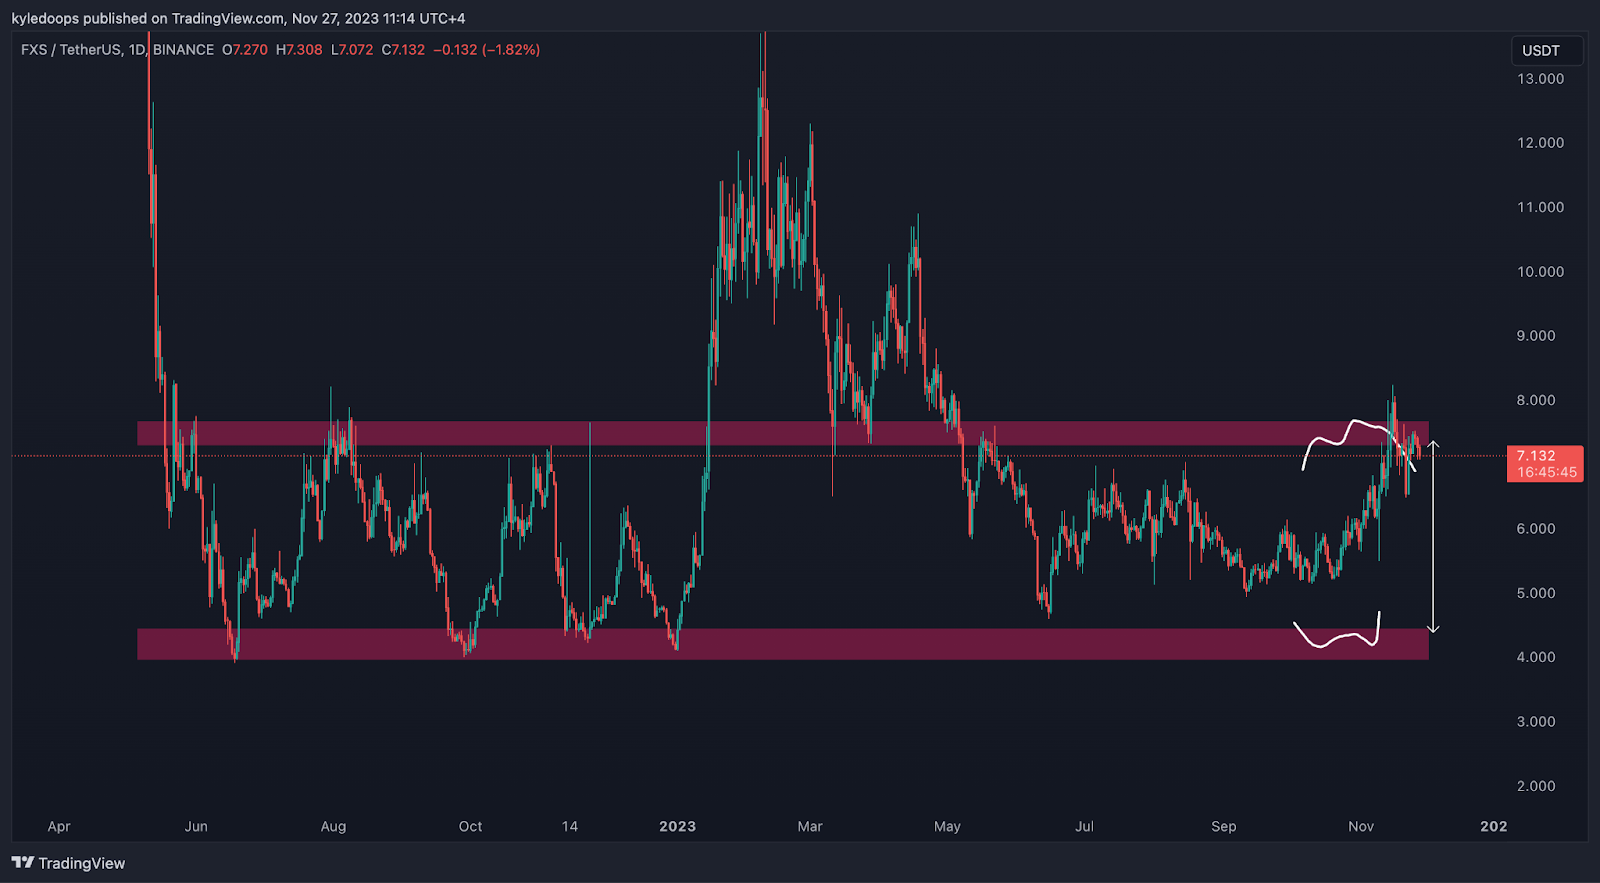
FXS is currently deviating back into its range, with the range levels as follows: Range high at $7.50 and range low at $4.00.
We would not recommend going long here unless the price can reclaim and hold above $7.50.
Otherwise, it presents a shorting opportunity to short it back down to the mid-range at $5.75, which is interim support.
Claim your Bitget sign-up bonuses here (details below).
Chart #4 - The Sandbox (SANDUSDT) Daily
Chartist: Sheldon
(For the chart screenshot, click here.)
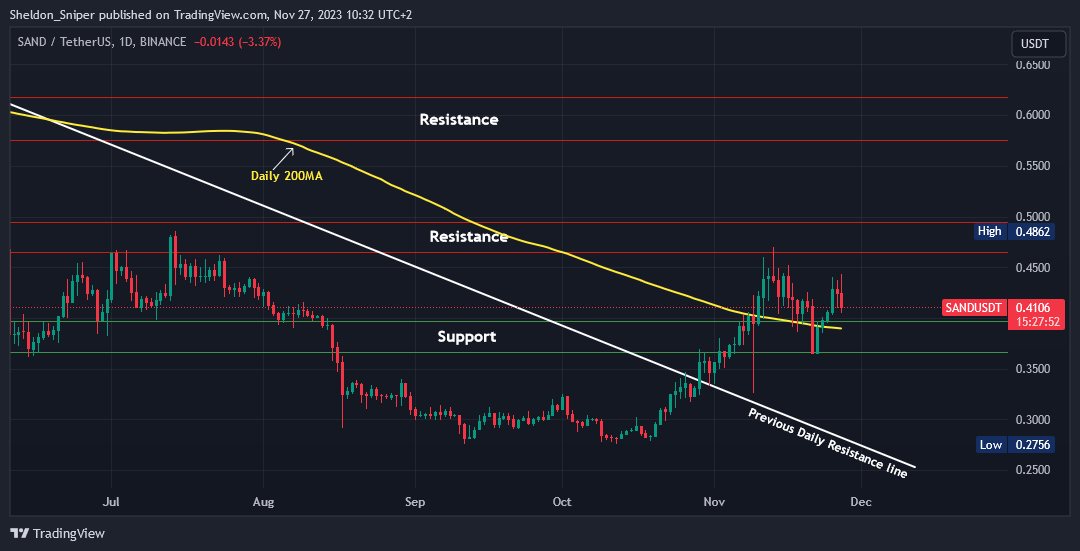
After breaking through the previous daily resistance line at the end of October, SAND has come down to retest the breakout at $0.37 - $0.40.
Both this support area and the daily 200 Moving Average (MA) are currently serving as support. If the market holds, I expect SAND to firstly test $0.47 - $0.50, followed by $0.57 - $0.62.
If the $0.37 - $0.40 area does not hold however, the next support is at $0.30 - $0.32.
Over the last couple of weeks, the metaverse narrative has not really moved like some of the other alts, therefore I believe there is an opportunity here.
Claim your Bitget sign-up bonuses here (details below).
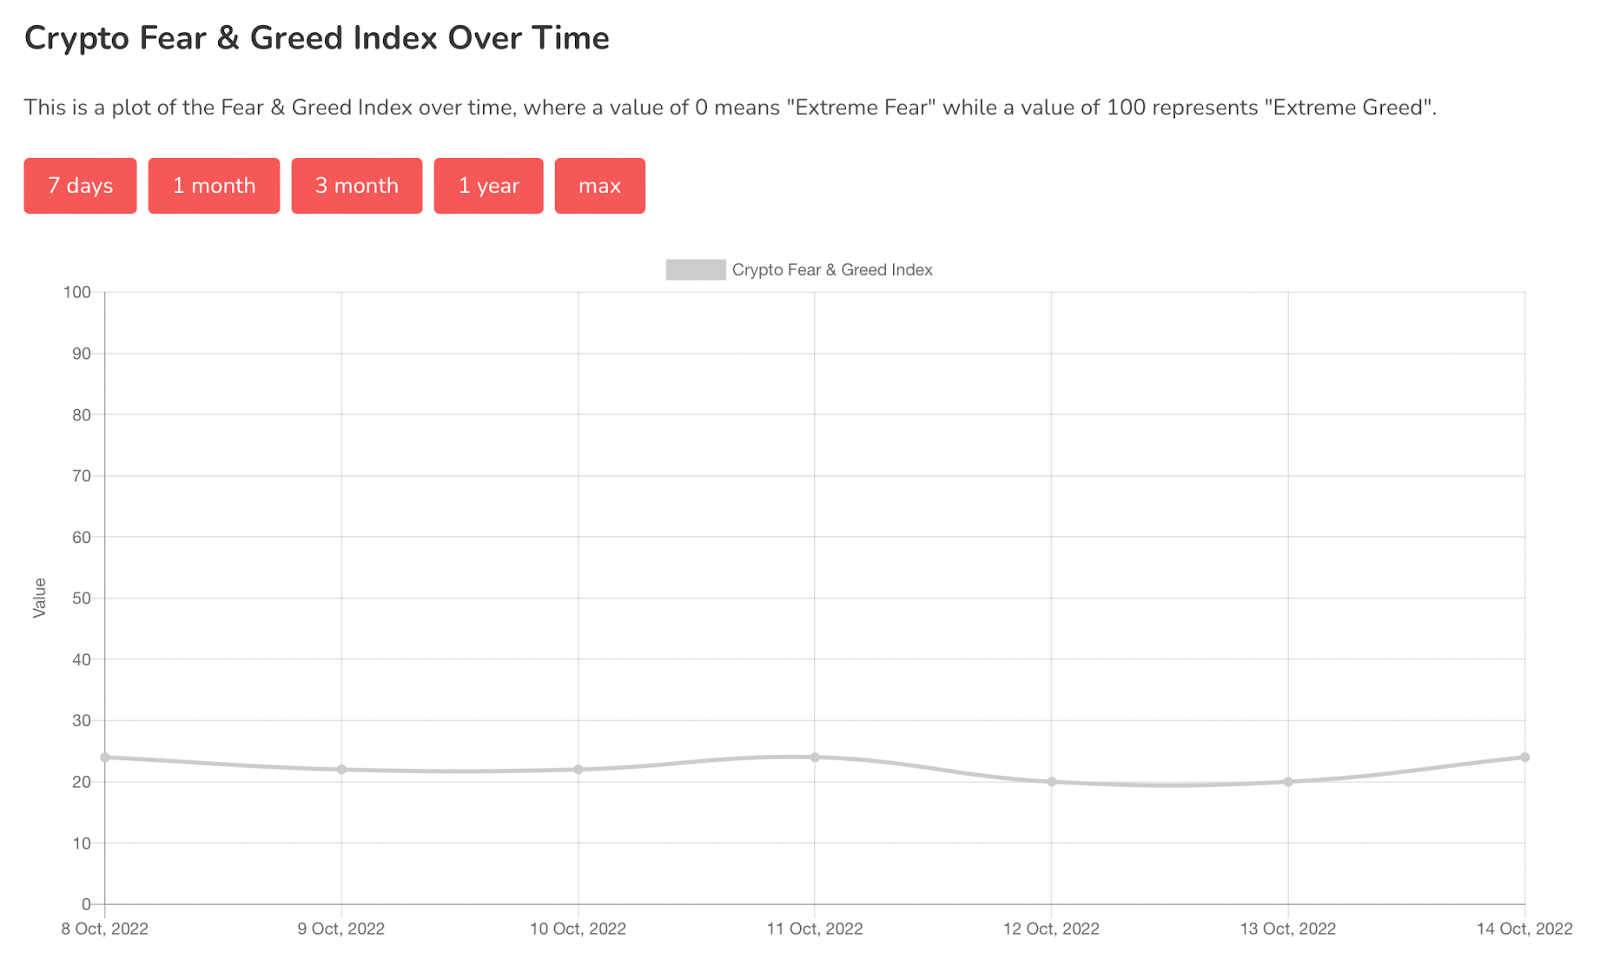
Chart #5 - Fear and Greed Index
The Fear and Greed Index is sitting at 66 today, indicating Greed.
The highest the index has been over the past seven days is 73, and the lowest is 62.
Banter’s Take
If Bitcoin experiences a pullback, the key support levels to watch are $35,000 followed by $32,000. The $32,000 level is crucial; if it fails to hold, the price could significantly decrease.
Stay safe my friends!
Go to our Crypto Banter Discord here where Sheldon and Kyle give updates on the charts and trades from The Daily Candle newsletter!