

📈📉 Our Next Bitcoin Long Entry Is At…
📈📉 Our Next Bitcoin Long Entry Is At…

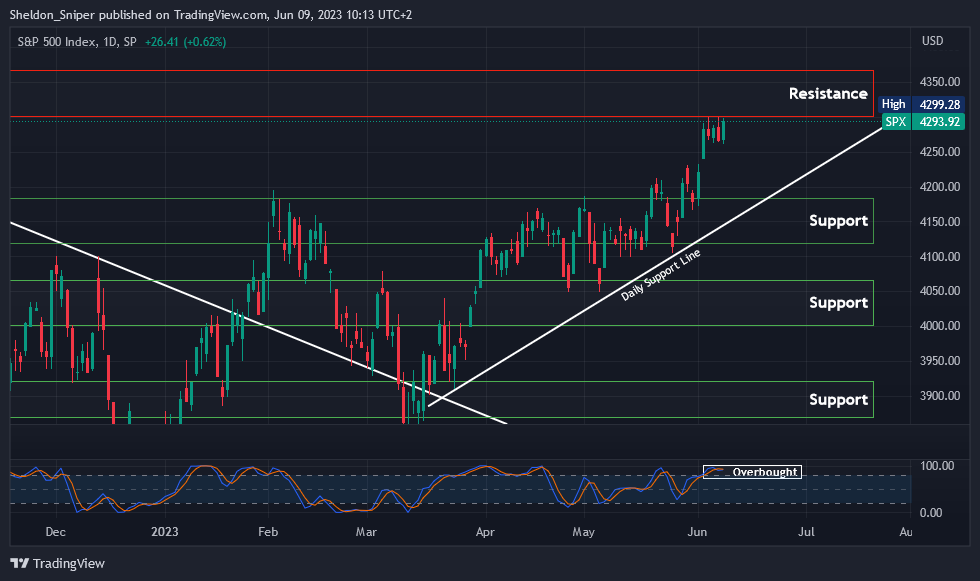
Chart #1 - S&P 500 1-Day Chart
Chartist: Sheldon
(For the chart screenshot, click here.)
The SPX is currently testing the 4,300 - 4,360 area of resistance and is also overbought on higher time frames, which indicates a possible retrace in the next few days.
Such a retrace could bring the S&P 500 down to test the next area of support at 4,125 - 4,175. This is where the daily ascending support line, originating from mid-March, can also be found, providing additional support.
If the SPX continues to trend higher, the current area of resistance extends up to 4,360, and it will likely be challenging to break through on the first attempt. The question remains: if the US stock market retraces from current levels, will it take down the oversold crypto market with it?
Sign-up and trade on Bybit today.
Exclusive $30,000 deposit rewards and bonuses up for grabs!
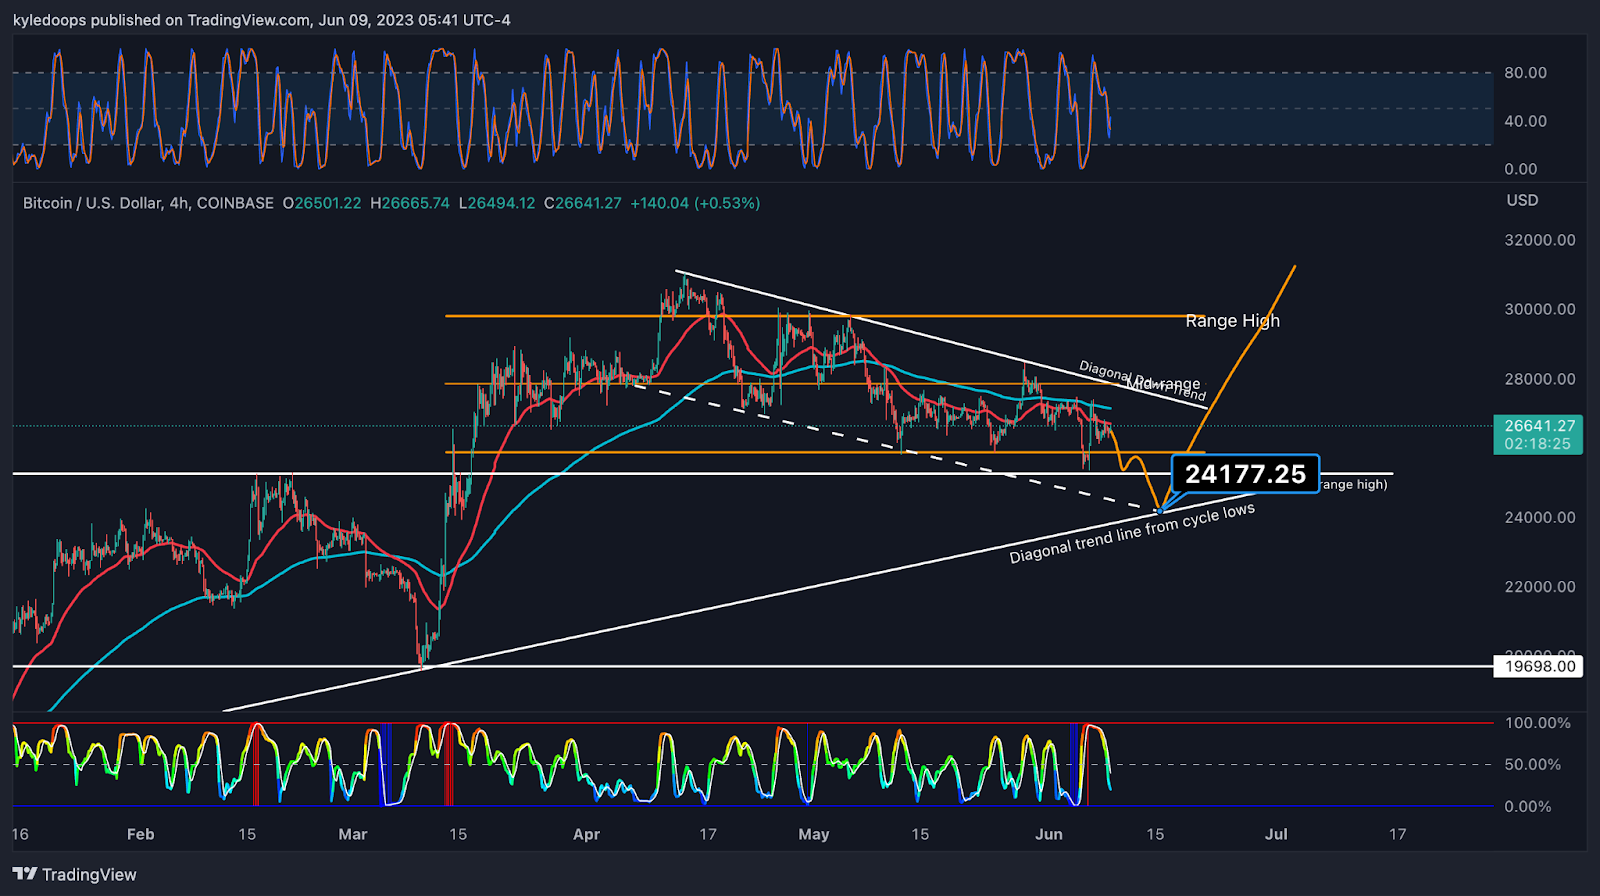
Chart #2 - Bitcoin (BTCUSD) 4-Hour Chart
Chartist: Kyle
(For the chart screenshot, click here.)
Bitcoin continues to sit below its EMA resistance.
The most ideal scenario would be a sweep of the range lows one more time before a subsequent breakout. So, if the price drops to the bottom of the channel, around $23K - $24K, it would present an excellent opportunity to make a long entry.
𝗣𝗿𝗶𝗺𝗲 𝗫𝗕𝗧
Sign up for a new Trading Account on Prime XBT!
Receive a deposit bonus of up to $7,000 with promo code: KyleDoops

Sign up for a new Trading Account on Prime XBT!
Receive a deposit bonus of up to $7,000 with promo code: SheldonSniper
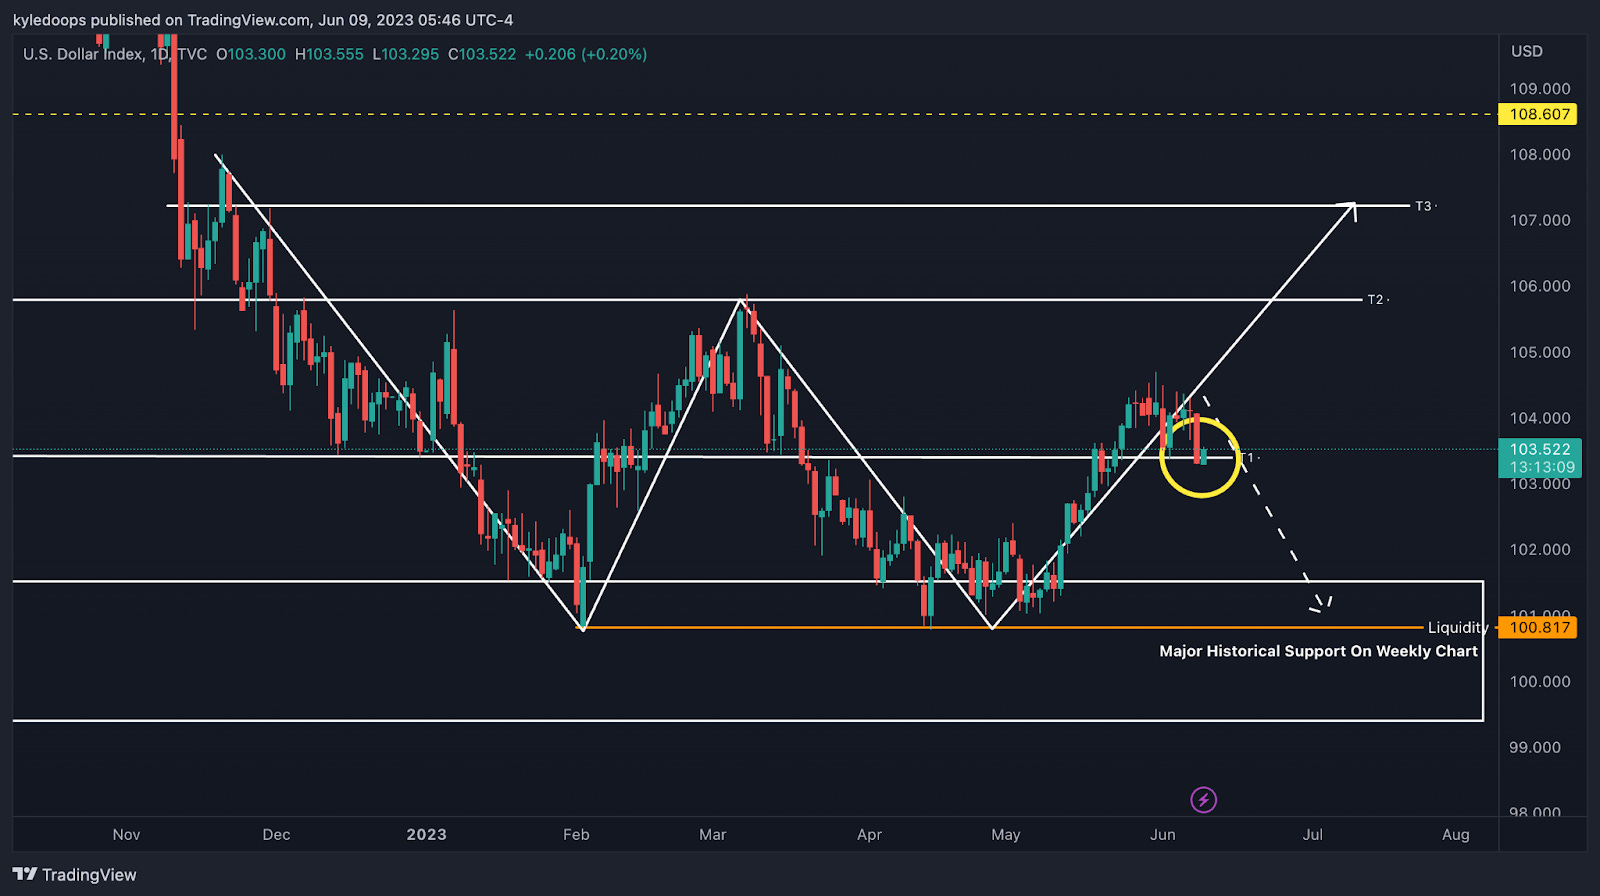
Chart #3 - U.S. Dollar (DXY) 1-Day Chart
Chartist: Kyle
(For the chart screenshot, click here.)
The DXY closed a day below 103.43, which might signal the start of a more significant pullback.
Watch for another close under this level. If the price closes below 103.43 once more, the odds will increase substantially for the DXY to set a lower high.
Remember, a lower high in the DXY typically bodes well for risk-on assets. That's because a rising DXY usually means a falling stock market, while a falling DXY tends to mean a rising stock market.
Claim your Bitget sign-up bonuses here (details below).
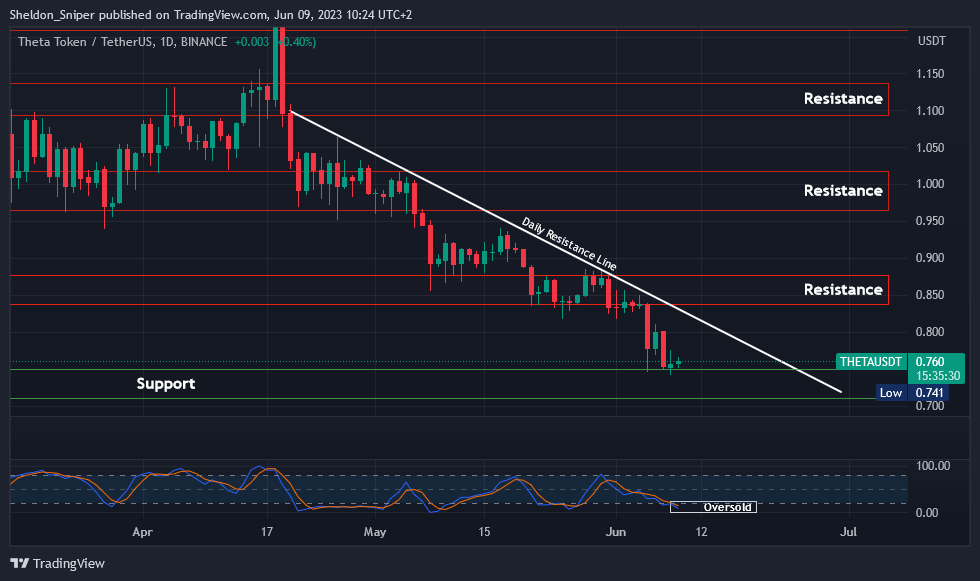
Chart #4 - Theta Network (THETAUSDT) 1-Day Chart
Chartist: Sheldon
(For the chart screenshot, click here.)
THETA has entered a major area of support between $0.74 - $0.76, last tested at the end of December.
With the price nearing oversold on higher time frames, THETA should gear up over the next couple of days to climb higher and test the descending resistance line from mid-April, around $0.80. If the price can break that line, it should then make its way to $0.84 - $0.87.
The total crypto market is almost oversold, and I anticipate a relief rally over the next couple of weeks. THETA is definitely one of the coins I see moving higher when that rally occurs.
Claim your Bitget sign-up bonuses here (details below).
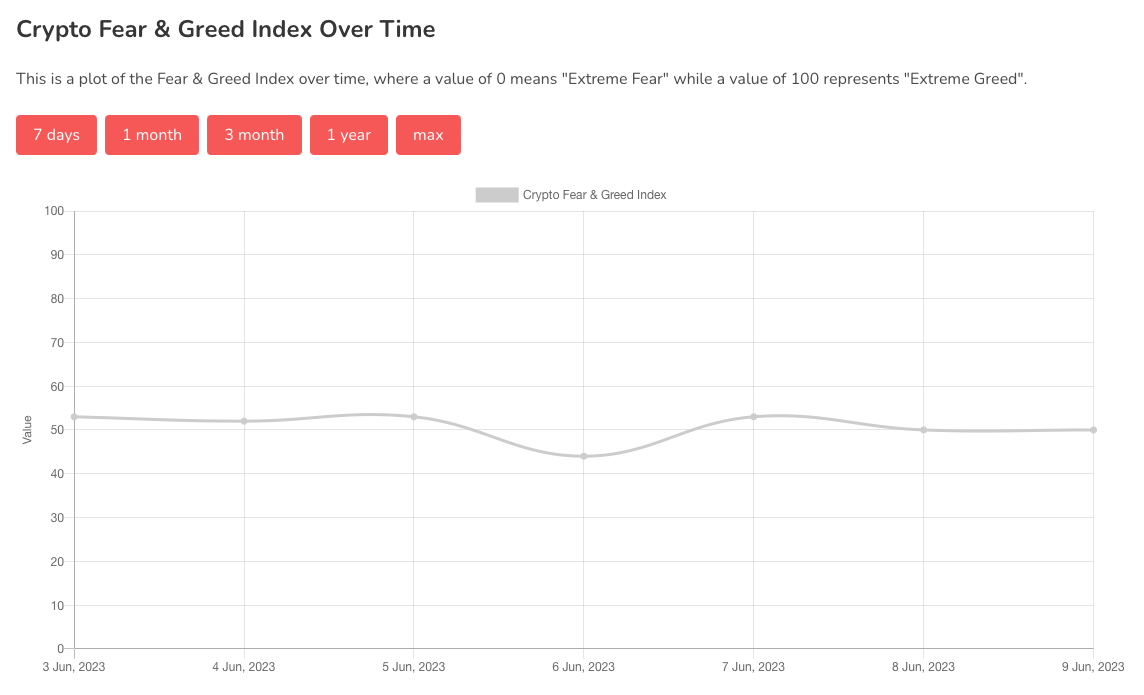
Chart #5 - Bitcoin Fear and Greed Index
The Bitcoin Fear and Greed Index is sitting at 50 today, Neutral.
The highest the index has been over the past seven days is 53, and the lowest is 44.
Banter’s Take
The market has a high chance of consolidating within a tight range for a couple more days as we approach the FOMC meeting coming up on Tuesday the 13th of June.
Most market participants will be waiting for that meeting before trading again, a behavior that usually causes small tight ranges.
Stay safe my friends!
Go to our Crypto Banter Discord here where Sheldon and Kyle give updates on the charts and trades from The Daily Candle newsletter!