

📈📉 Potential +350% on THIS Altcoin Trade!
📈📉 Potential +350% on THIS Altcoin Trade!
FOUR Altcoin Trades To Take NOW!
Overview
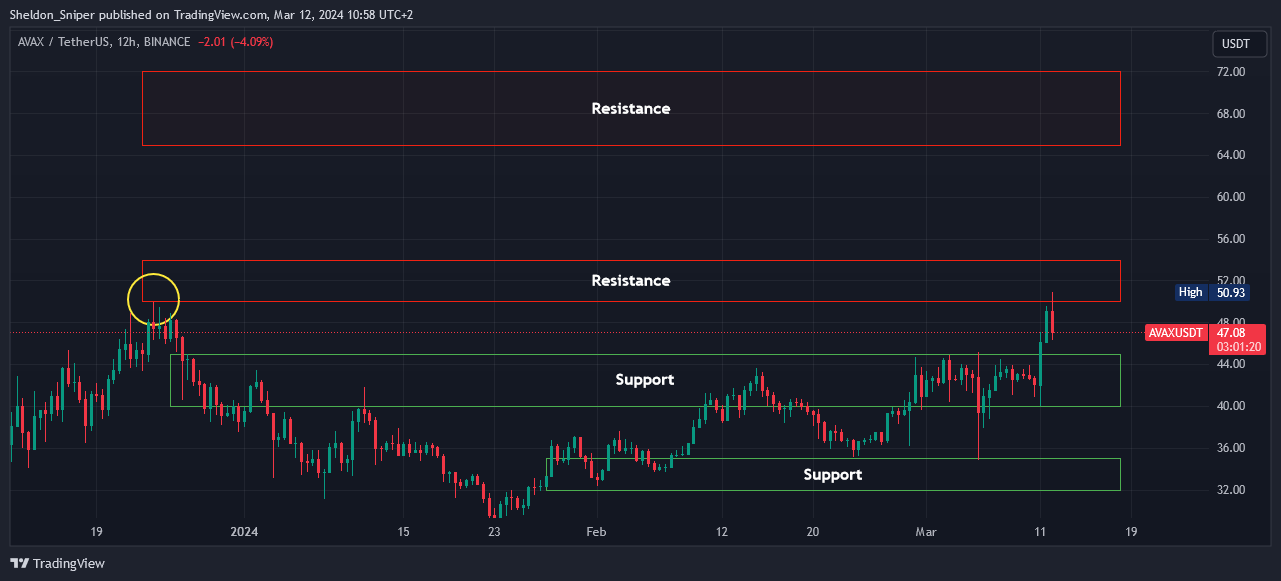
Chart #1 - Avalanche (AVAXUSDT) 12-Hour
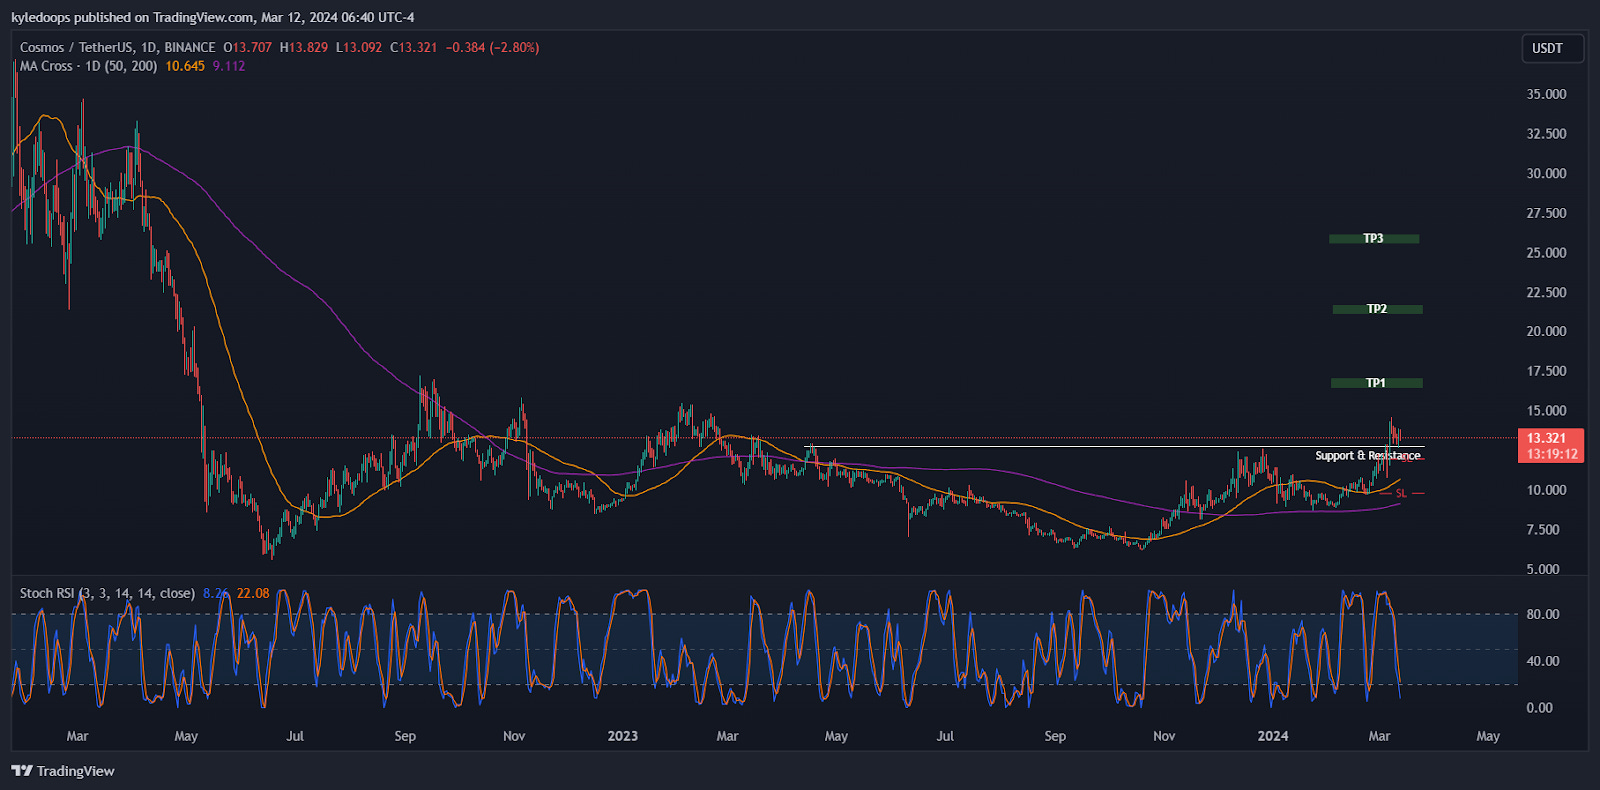
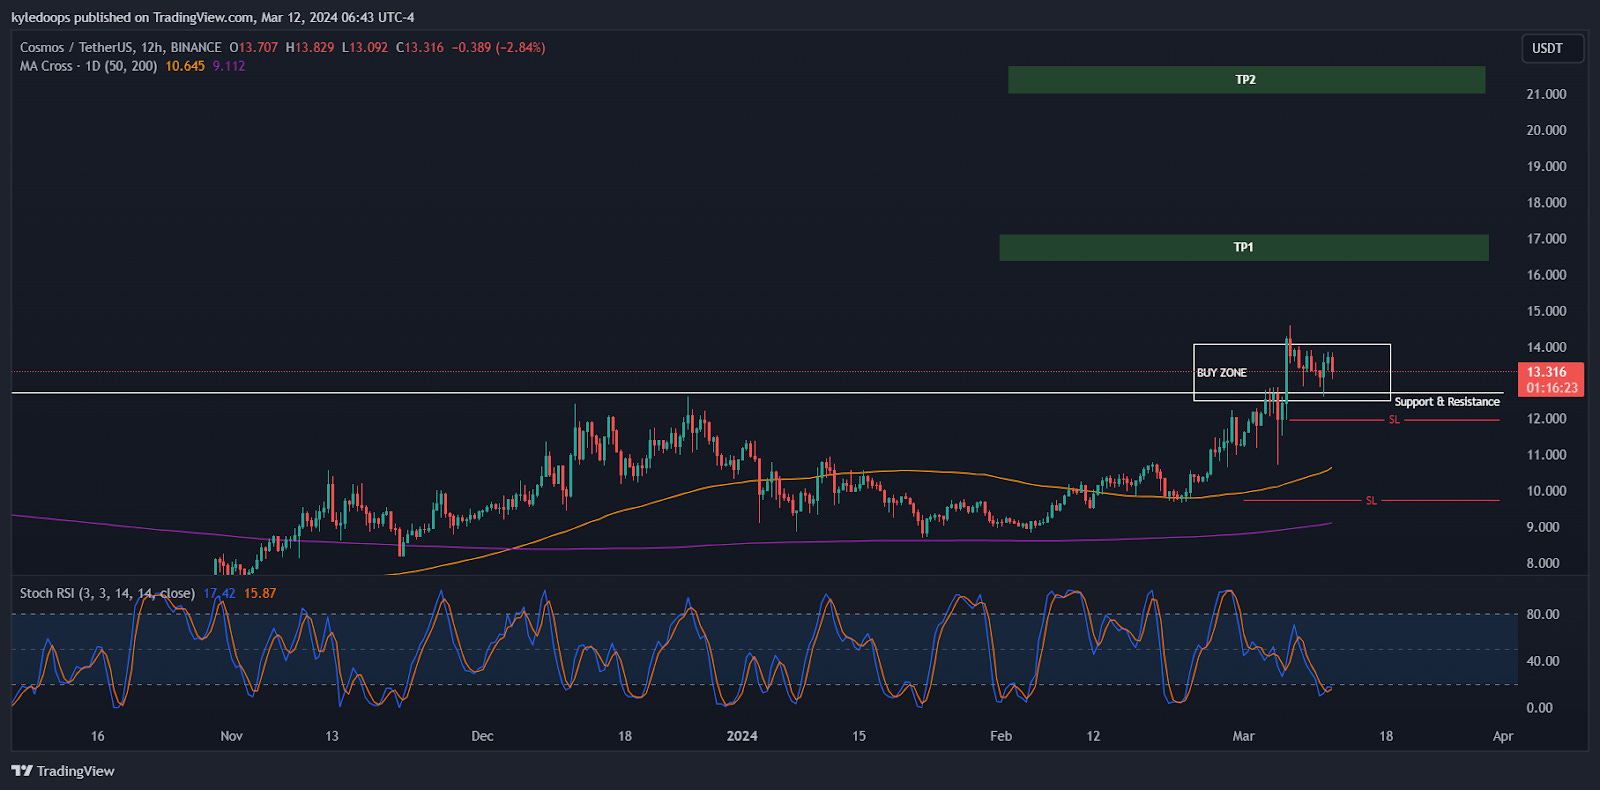
Chart #2 - Cosmos Hub (ATOMUSDT) Daily and 12-Hour
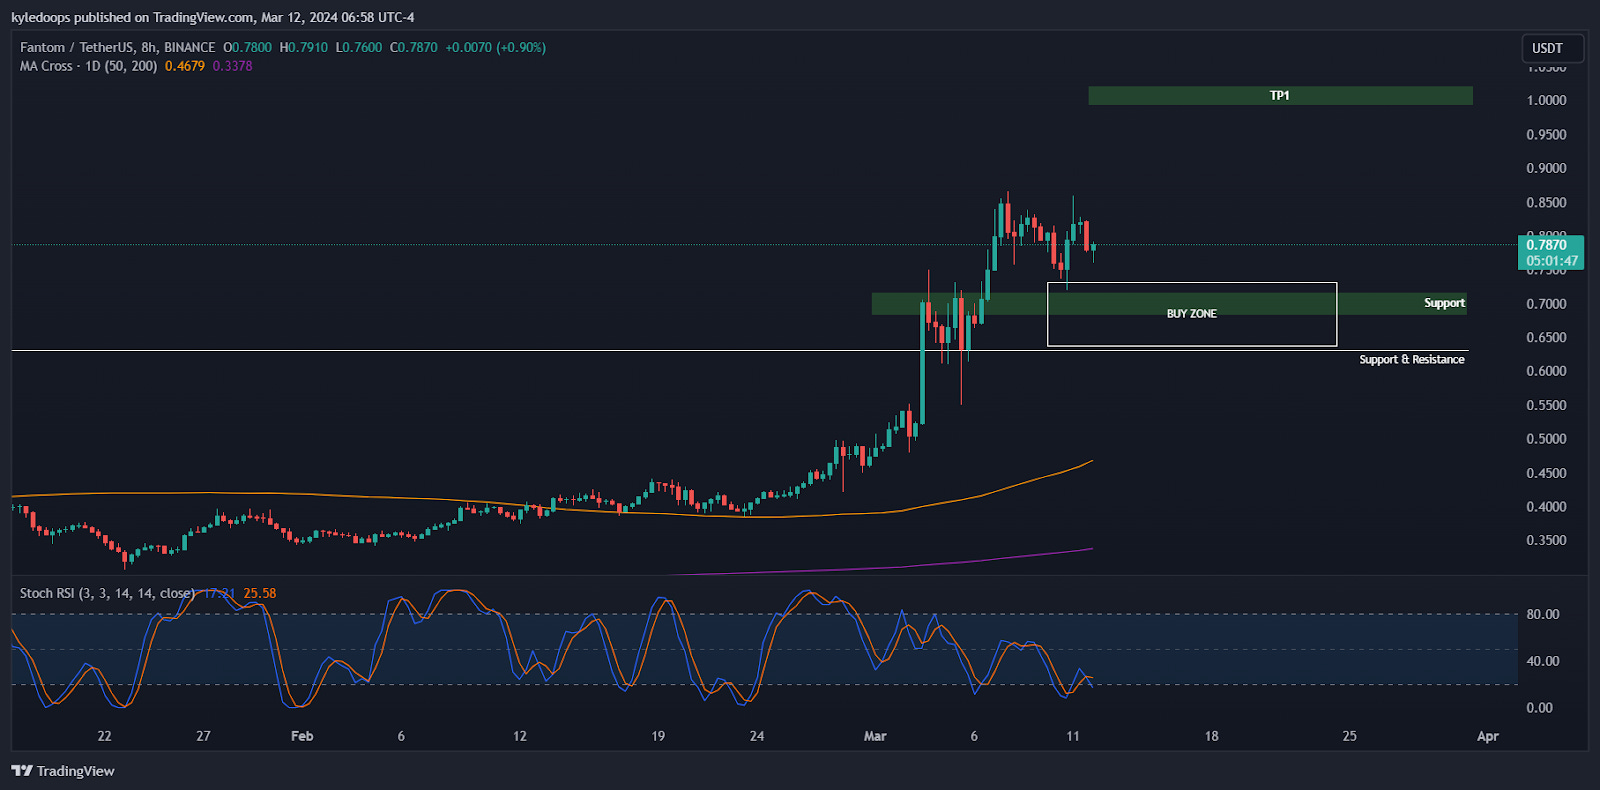
Chart #3 - Fantom (FTMUSDT) 8-Hour
Chart #4 - Internet Computer (ICPUSDT) 8-Hour
Chart #5 - Fear and Greed Index
Chart #1 - Avalanche (AVAXUSDT) 12-Hour
Chartist: Sheldon
(For the chart screenshot, click here.)
Yesterday AVAX surged by more than 20%, but then got rejected at around $50.00 and is coming down to retest the break at $45.00.
Entry: Ladder into a spot trade if price comes down to retest the $44.50 - $45.00 area and holds as support.
Take Profit:
TP1: 25% at the $50.00 - $54.00 area of resistance (12% - 21%)
TP2: The balance at the $65.00 - $72.00 area of resistance (46% - 62%)
Stop Loss: Just below $40.00
Sign-up and trade on Bybit today.
Exclusive $30,000 deposit rewards and bonuses up for grabs!
Chart #2 Cosmos Hub (ATOMUSDT) Daily and 12-Hour
Chartist: Kyle
(For the chart screenshot, click here.)
(For the chart screenshot, click here.)
ATOM is looking bullish for a continuation to the upside with turning the $12.50 area into support. Holding this area opens up a new range!
Entry: Between $12 - $14
Stop Loss
Soft Stop with a daily close below $12
Hard Stop with price closing below $10
Take Profit (TP)
TP1: $17
TP2: $21 to $22
TP3: $31
From $12 to $31 is a massive 350% trade which you can take on Bitget.

Outsmart 99% Of The Market!
Get full access into our Discord And Telegram group, where you'll find all of our premium content!
👉 Trade Signals!
👉 Trade Set-Ups!
👉 Trading Challenges!
👉 Education!
👉 SO MUCH MORE!
Chart #3 - Fantom (FTMUSDT) 8-Hour
Chartist: Kyle
(For the chart screenshot, click here.)
FTM has broken the $0.6c area of resistance and flipped it into support for trend continuation. We’ll look for any retest of our buy zone in order to gain market exposure and ride it up to $1 (as an initial TP area).
Entry: Between $0.63 - $0.75
Take Profit:
TP1: $1
TP2: $1.6
Stop Loss: $0.55
Claim your Bitget sign-up bonuses here (details below).
Chart #4 - Internet Computer (ICPUSDT) 8-Hour
Chartist: Sheldon
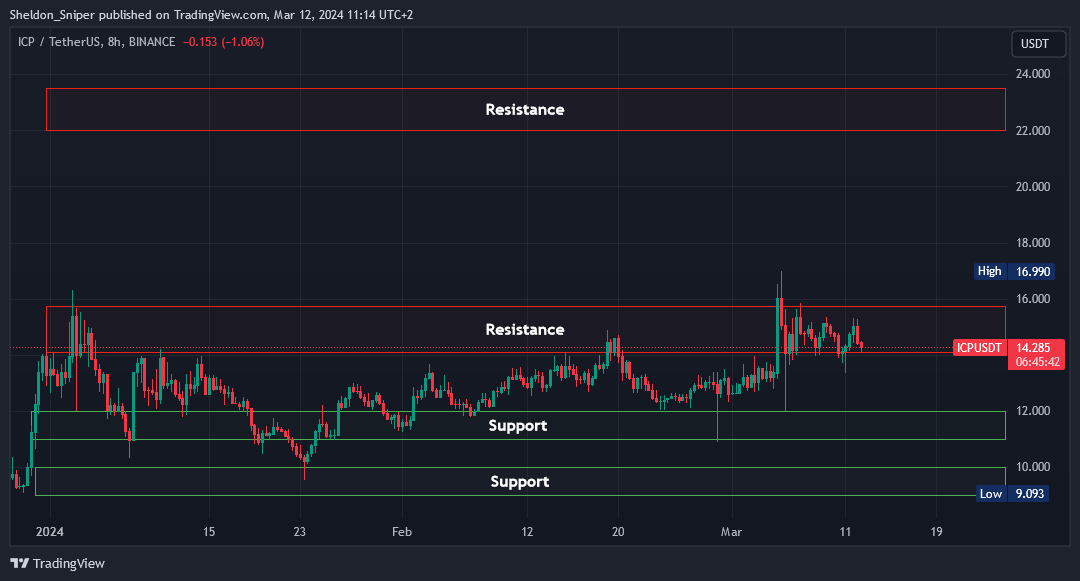
(For the chart screenshot, click here.)
The Banter Team is very bullish on ICP for this bull run.
Price has come down a lot over the last two and a half years. Its all-time high was at $2,800 when it launched in May 2021. I don’t think it will revisit that high price in this cycle, but the September 2021 high of $85.00 is a reasonable target.
I am patiently waiting for ICP to come down to my buy area between $11.00 - $12.00 so I can enter a long spot trade.
Entry: Ladder in at the $11.00 - $12.00 area of support.
Take Profit:
TP1: 25% at the $14.00 - $15.75 area of resistance (27% - 43%)
TP2: The remaining balance at the next area of resistance at $22.00 - $23.50 (100% - 114%)
Stop Loss: Just below $10.60
Claim your Bitget sign-up bonuses here (details below).
Chart #5 - Fear and Greed Index
The Fear and Greed Index is sitting at 81 today, indicating Extreme Greed.
The highest the index has been over the past seven days is 84, and the lowest is 75.

Banter’s Take
Bitcoin is holding strong at $72k, and we are still looking bullish. Will the previous high of $69k now hold as support and flip the previous resistance? The weekly remains bullish and is pushing off into discovery, as previously noted, with a high probability, holding $59k as our key invalidation zone that would indicate BTC is making a move to lower levels.
I previously touched on the funding rates, which are still green, showing there is still a lot of gas left in the tank for more leverage to enter in before we become overheated. Watch at my show today for a more detailed explanation on where I see the market moving next.
Stay safe, my friends!
Go to our Crypto Banter Discord here where Sheldon and Kyle give updates on the charts and trades from The Daily Candle newsletter!