

📈📉 Potential RUNE trade! BTC needs to hold this level!
📈📉 Potential RUNE trade! BTC needs to hold this level!

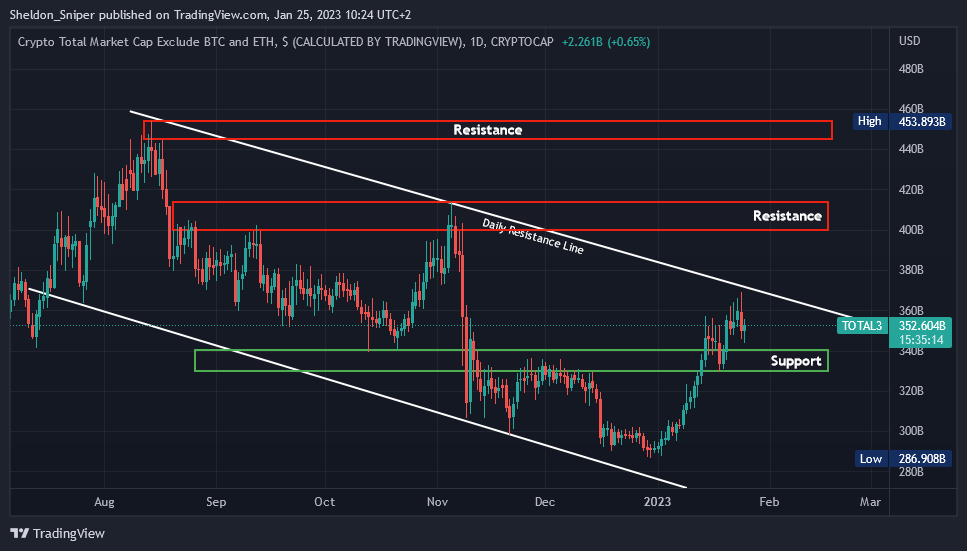
Chart #1 - TOTAL3 1-Day Chart
Chartist: Sheldon
(For the chart screenshot, click here.)
The TOTAL3 has been in a massive downtrend since mid-August, while BTC dominance has been increasing. And the last three weeks have shown that we have had more of a BTC rally than an altcoin one.
I feel altcoins now need to catch up to BTC.
The TOTAL3 has been trending in a falling channel structure for six months, a usually bullish pattern that leads to a breakout. And yesterday, the TOTAL3 got rejected at the upper daily descending resistance line, at around $370B, before retracing back down to $350B.
So, we may see further downside, and a test of the $330B - $340B area of support which, if successfully held, could set the TOTAL3 up to break out of the falling channel structure and test $400B and $450B.
Check our Crypto Banter Discord here for updates!
Follow me on Twitter for urgent updates on my trading progress!
Claim your Bitget sign-up bonuses here (details below).
Winning Bitget UID - 2516274665
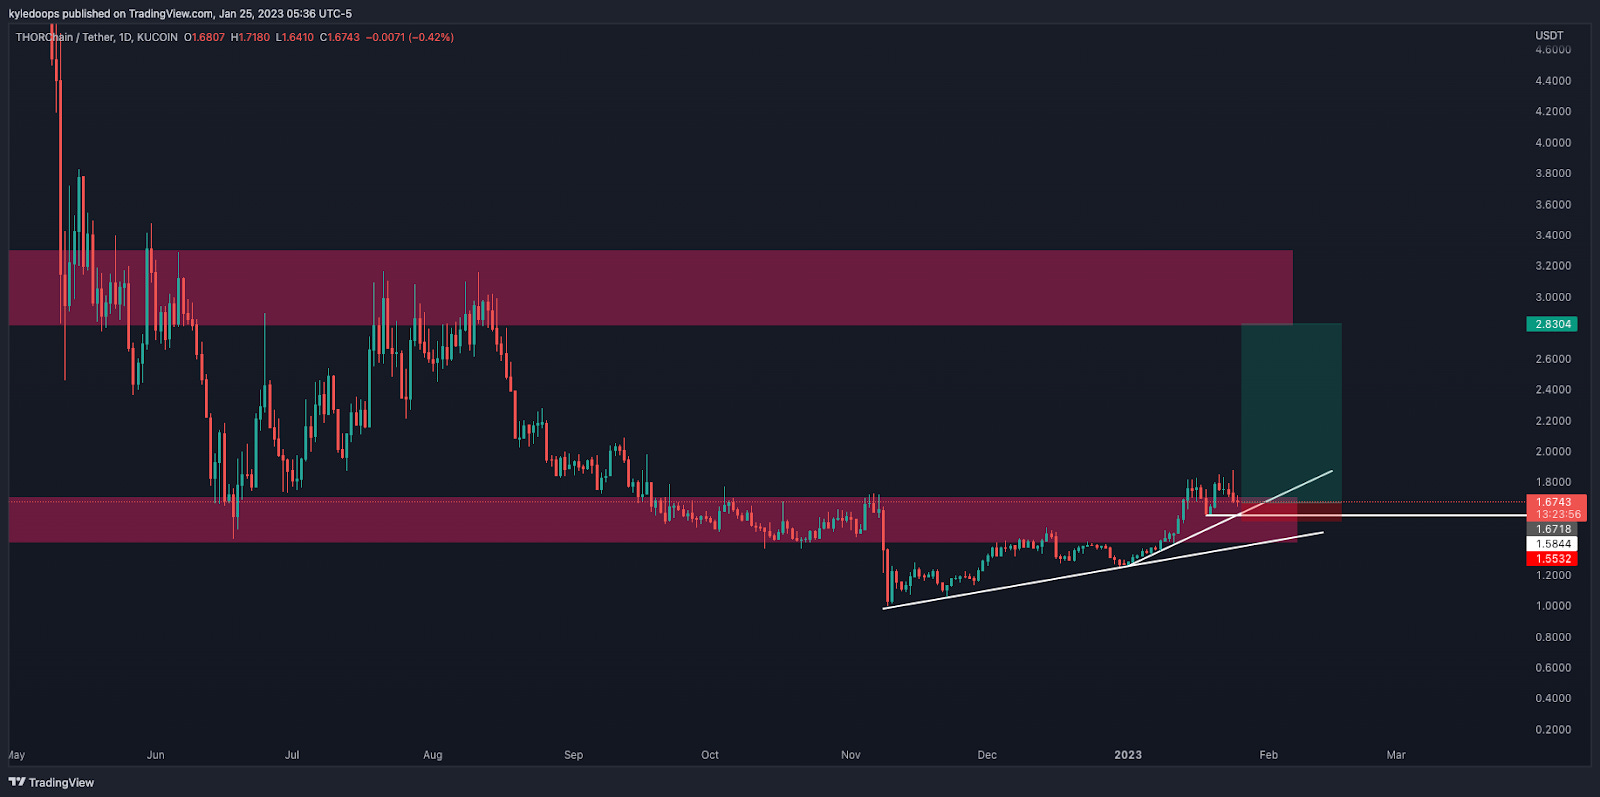
Chart #2 - THORChain (RUNEUSDT) 1-Day Chart
Chartist: Kyle
(For the chart screenshot, click here.)
RUNE could be successfully breaking back into its range-low, which, should it hold up, would provide an opportunity to go long.
If RUNE moves up to the mid-range, followed by the range-high, taking a long trade with a tight stop loss at $1.58 could mean massive profits - approximately 69% on a spot trade alone. That is almost a 1:10 trade.
But if the price drops, a return back down to $1.38 is possible.
Check our Crypto Banter Discord here for updates!
Make sure to follow me on Twitter, where I will post updates on my trades as they unfold!
Claim your Bitget sign-up bonuses here (details below).
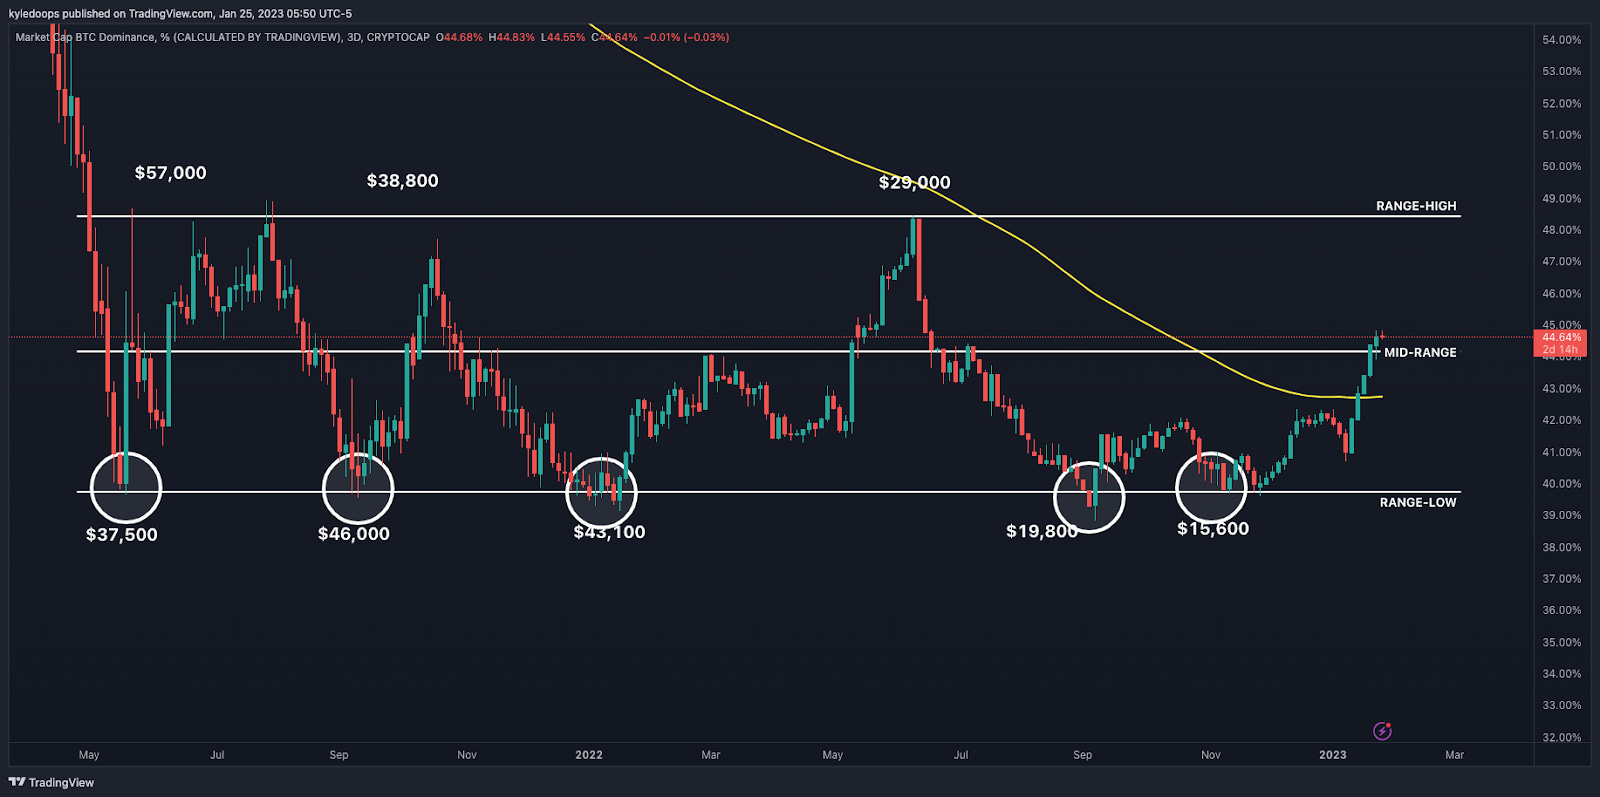
Chart #3 - Bitcoin Dominance (BTC.D) 3-Day Chart
Chartist: Kyle
(For the chart screenshot, click here.)
It is worth looking at your favorite altcoin against the BTC chart. For example, if you want to trade ETH, look at the ETH/BTC chart to make sure it's in an uptrend.
The reason for mentioning this is because BTC Dominance is currently holding above the mid-range, and, unless it deviates and drops back down, most altcoins will struggle to outperform bitcoin.
If it can hold the mid-range, BTC Dominance may keep aggressively moving up and, over time, the range-high at 48% could become a potential target.
Check our Crypto Banter Discord here for updates!
Make sure to follow me on Twitter, where I will post updates on my trades as they unfold!
Claim your Bitget sign-up bonuses here (details below).
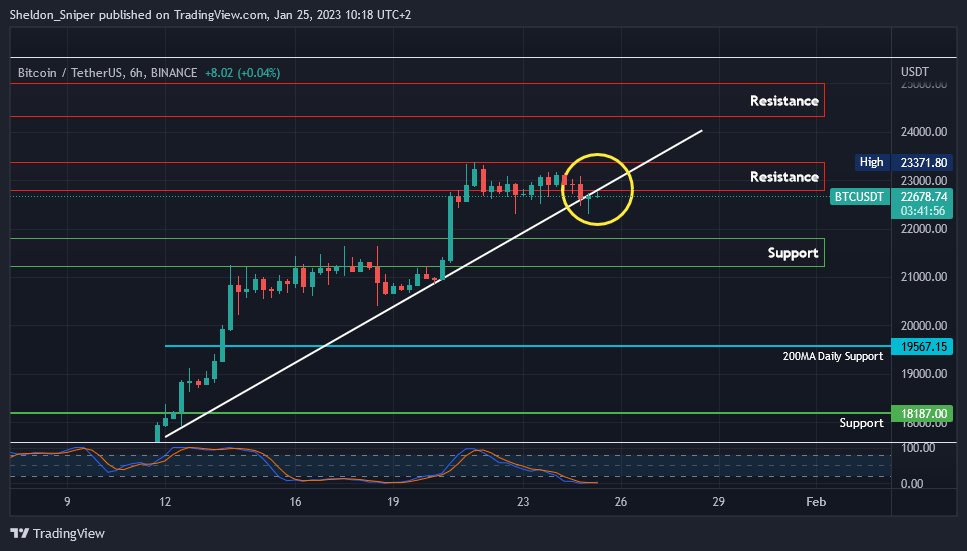
Chart #4 - Bitcoin (BTCUSDT) 6-Hour Chart
Chartist: Sheldon
(For the chart screenshot, click here.)
Last night, bitcoin broke through its daily support line that had held over the past two weeks, dropping to $22,300 before recovering back up to $22,700.
If BTC drops again it could test support levels at $21,300 - $21,800 or possibly even the daily 200 moving average at $19,567.
But if the price manages to reclaim the previous daily support line and break through $23,000, the next area of resistance is at $24,800 - $25,000.
Check our Crypto Banter Discord here for updates!
Follow me on Twitter to get all the updates on my personal trading progress!
Claim your Bitget sign-up bonuses here (details below).
Winning Bybit UID - 7961471
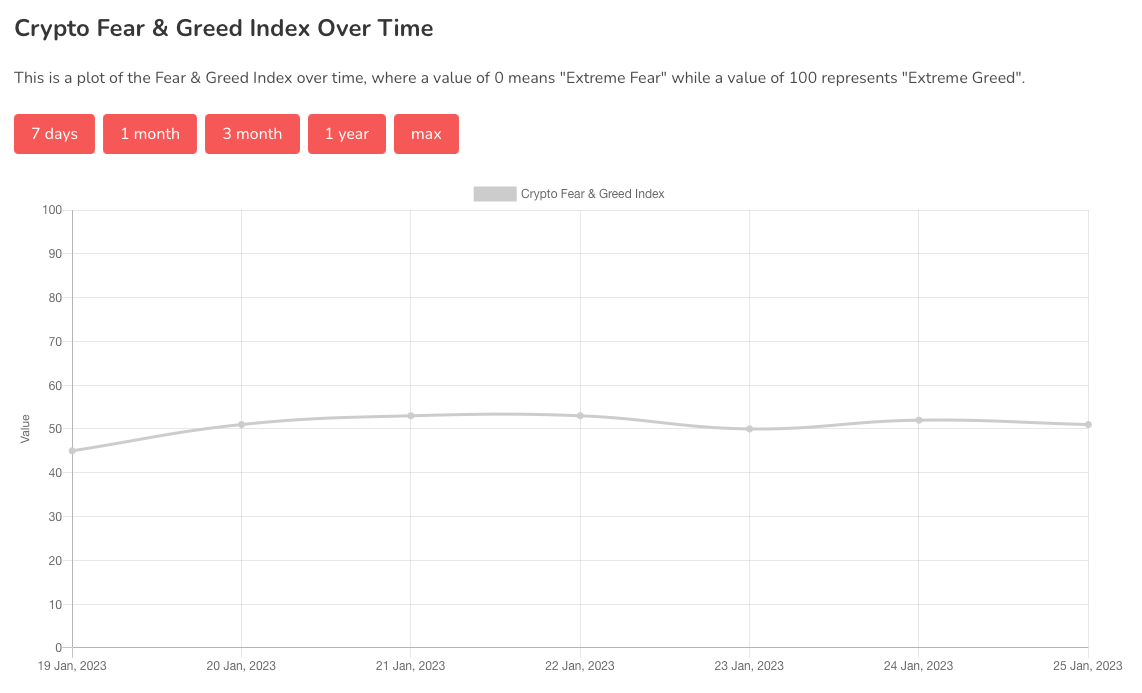
Chart #5 - Bitcoin Fear and Greed Index
The Bitcoin Fear and Greed Index is sitting at 51 today, Neutral.
The highest the index has been over the past seven days is 53, and the lowest is 45.
Overall Market Sentiment (Banter’s Take)
The stock market has not yet confirmed a proper break out of its descending trend line. And often, those breaks turn out to be traps. Therefore, until a candle closes above the current daily high, we'll treat the breakout as a potential trap and look for prices to cool back down.
Many earnings reports are coming out this week that could cause the stock market to plummet, taking crypto down with the ship. But, crypto coming down could potentially provide an opportunity to enter the next higher low.
Stay safe my friends!