

📈📉 Pre-FOMC fear increases! Alts at crucial levels!
📈📉 Pre-FOMC fear increases! Alts at crucial levels!

Bitget winner - 5985670958
Wondering what that 👆 is and how you can win? Then check out our daily shows on YouTube!
Are you using Bybit instead? Then look for the winning Bybit account below. But if you want to double your chances of winning, sign up today to both exchanges with the links found in the description of our YouTube videos!
Good luck to all!
Chart #1 - Fantom (FTMUSDT) 1-Day Chart
Chartist: Sheldon
(For the chart screenshot, click here.)
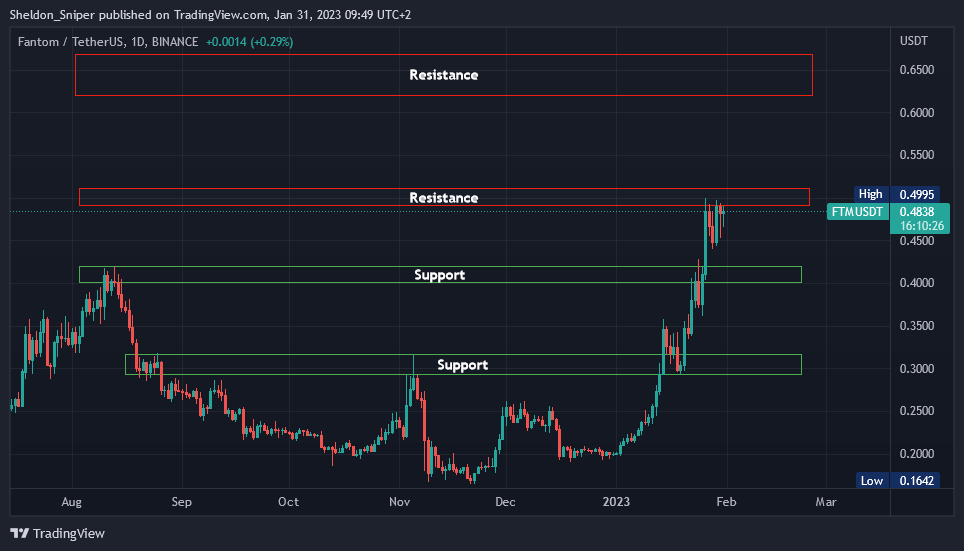
FTM has had a long run in January, moving from below $0.20 to just below $0.50 - a move of nearly 150% - and has had no proper correction to test its lower support levels.
But $0.50 is an area of resistance for FTM. So, if the price gets rejected here, it could test those lower levels.
The first crucial support level is around $0.40, followed by $0.30.
However, if the price moves higher from here, the next noteworthy area of resistance is between $0.625 - $0.66.
Check our Crypto Banter Discord here for updates!
Follow me on Twitter for urgent updates on my trading progress!
Claim your Bitget sign-up bonuses here (details below).
Chart #2 - Bitcoin Dominance and TOTAL3 1-Day Chart
Chartist: Kyle
(For the chart screenshot, click here.)
(For the chart screenshot, click here.)
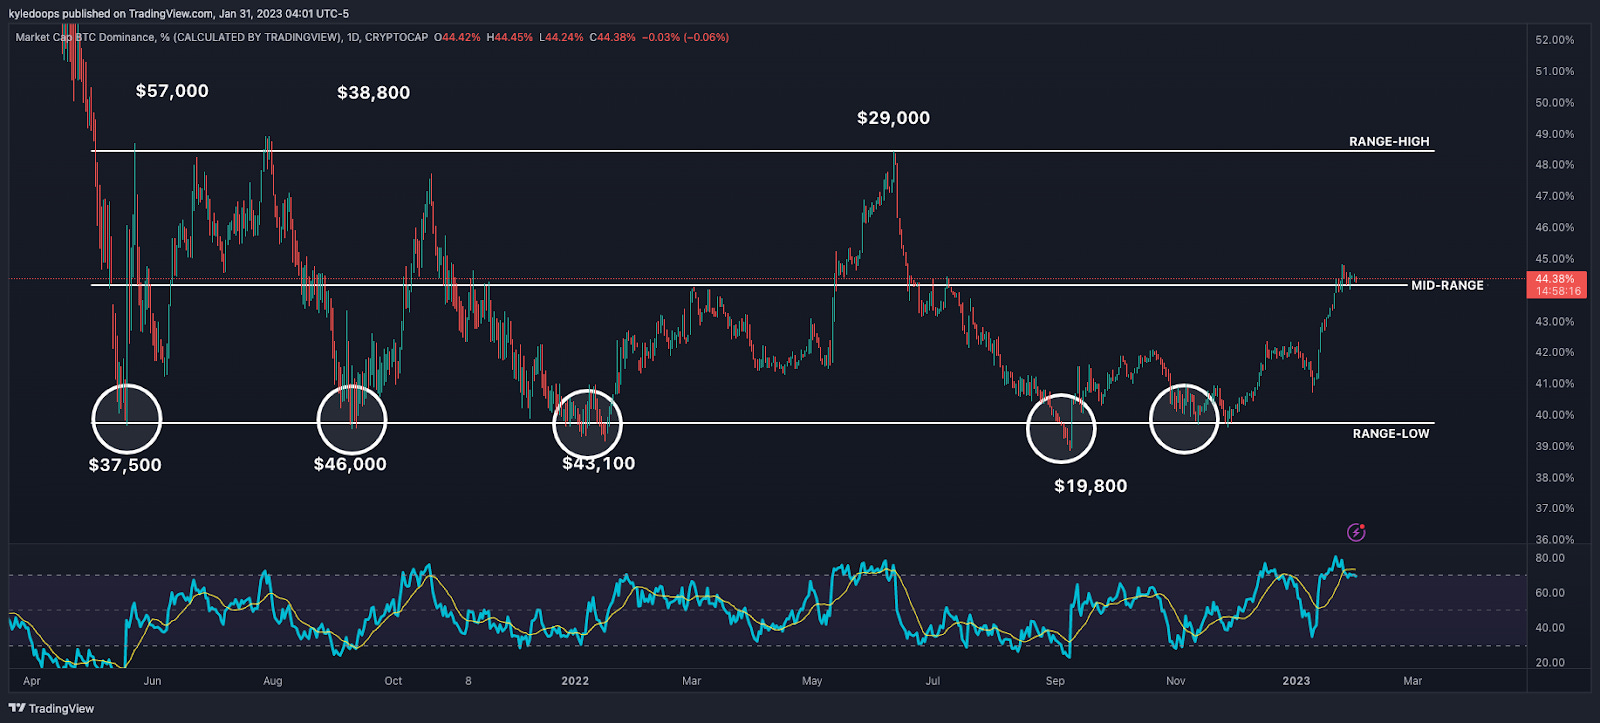
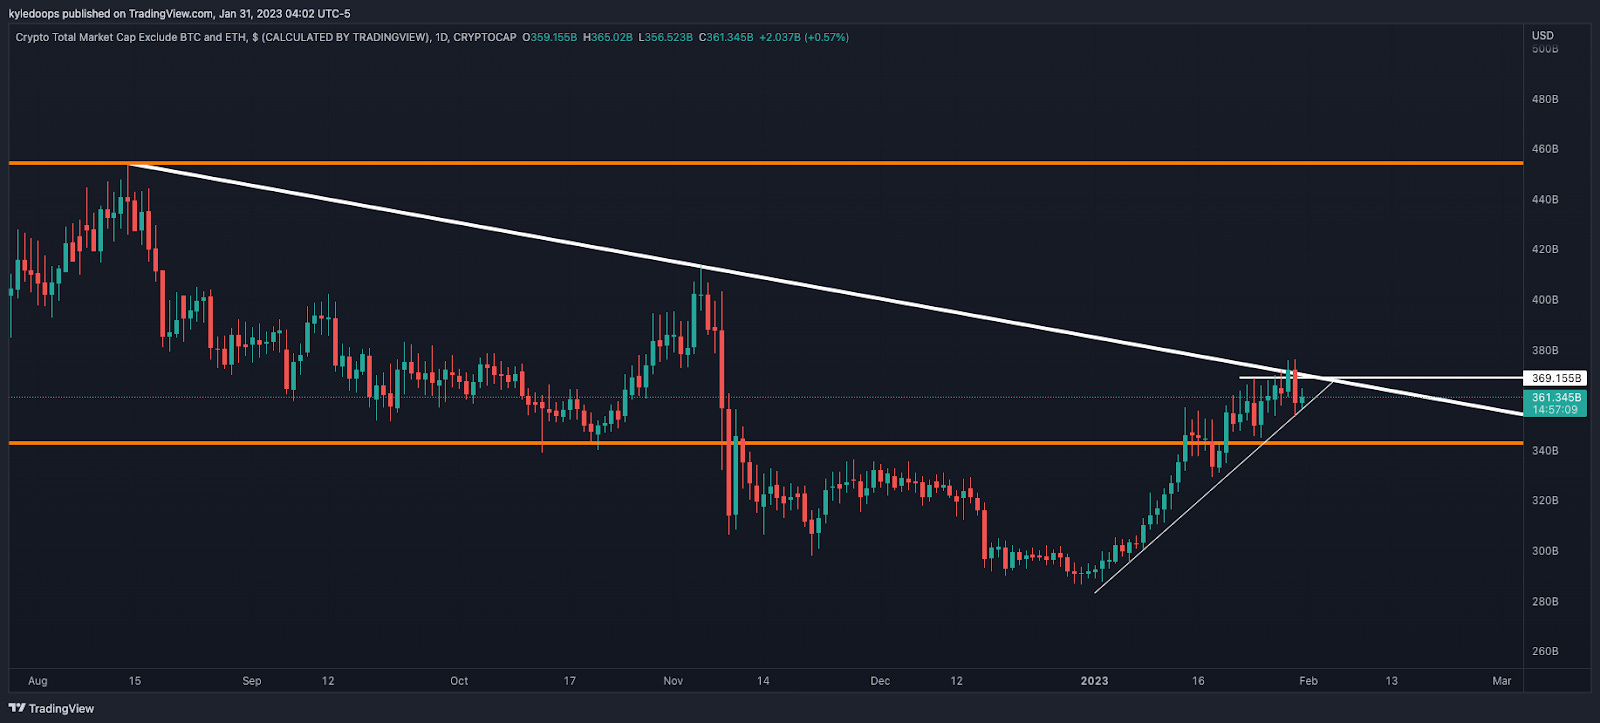
I'm looking at Bitcoin Dominance (BTC.D) in conjunction with the TOTAL3 on a daily chart.
If BTC.D holds above the mid-range and consolidates for a bit longer, it will likely continue pushing up, meaning the TOTAL3 will reject from its declining trend line.
On the contrary, a drop in BTC.D would give the TOTAL3 that final push to break its declining trend line, giving alts another massive move up.
Check our Crypto Banter Discord here for updates!
Make sure to follow me on Twitter, where I will post updates on my trades as they unfold!
Claim your Bitget sign-up bonuses here (details below).
Bybit winner - 2331812
Chart #3 - Bitcoin (BTCUSDT) 1-Hour Chart
Chartist: Kyle
(For the chart screenshot, click here.)
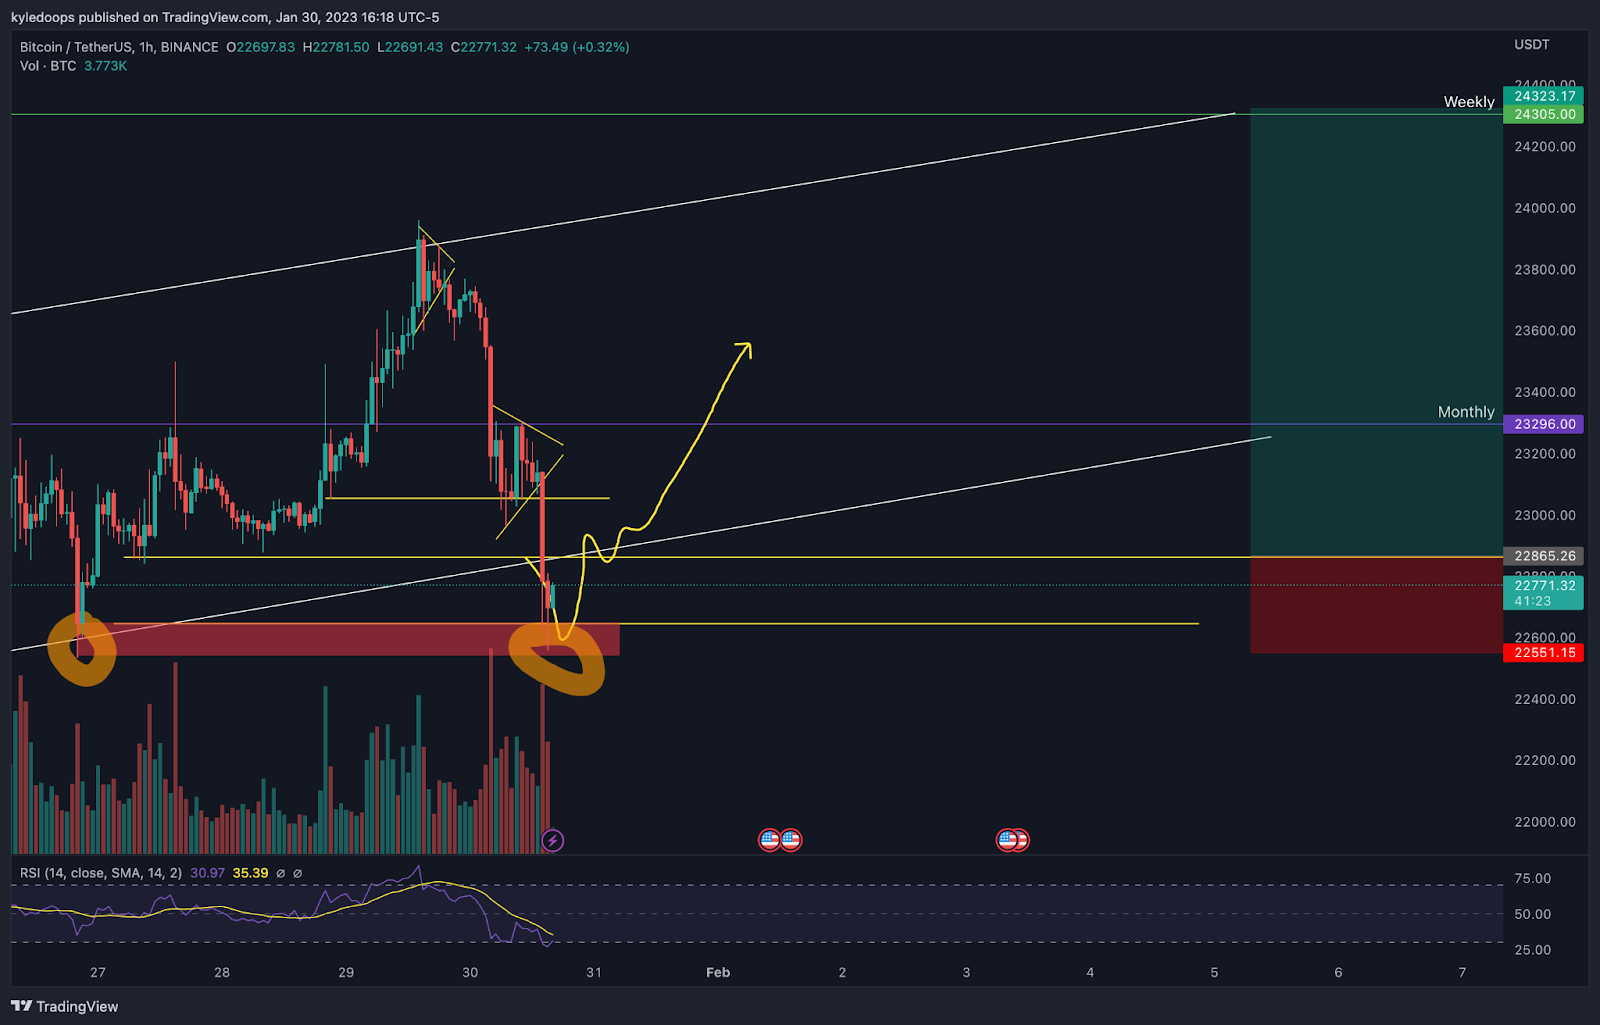
I will potentially be going long on BTC if its price breaks back into the parallel channel at $22,865.
I would place my stop loss under the wick low (that just printed) at $22,551.
My Take Profit 1 (TP1) will be at the key monthly level of $23,296, and my Take Proft 2 (TP2) at $24,305.
If the bulls can't get the prices to bounce back up quickly, the bears may take back control, and much lower prices are likely.
Check our Crypto Banter Discord here for updates!
Make sure to follow me on Twitter, where I will post updates on my trades as they unfold!
Claim your Bitget sign-up bonuses here (details below).
Chart #4 - Ethereum (ETHUSDT) 1-Day Chart
Chartist: Sheldon
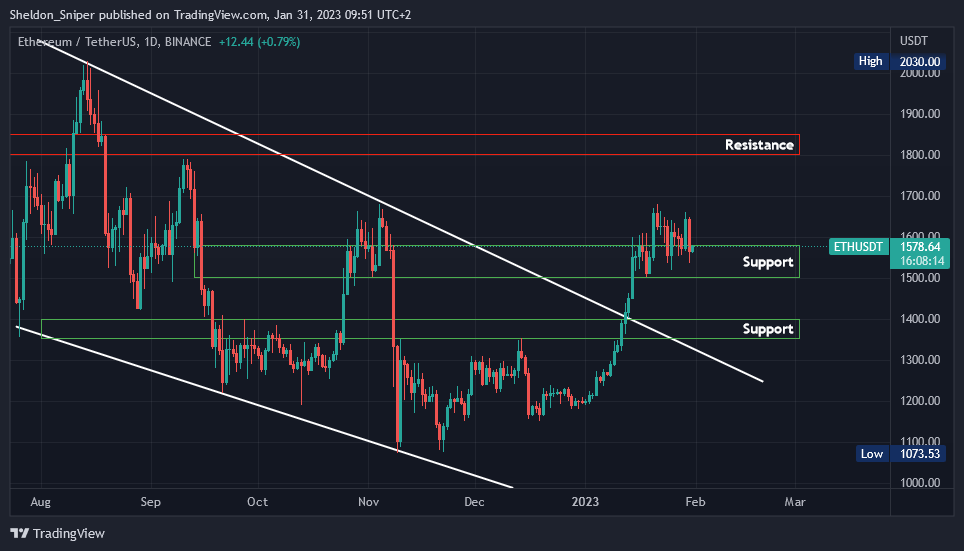
(For the chart screenshot, click here.)
In the first two weeks of January, ETH increased from $1,200 to $1,650. Then, in the following two weeks, it consolidated in the $1,500 - $1,650 range.
The market is overheated, implying we need a correction, but should the results of tomorrow's FOMC be favorable for the markets, it could push prices higher.
Considering that, if ETH does push upwards, the next level of resistance is at $1,800. But, if all comes crashing down and ETH breaks below $1,500, the next level of support is between $1,350 - $1,400.
We'll have a clearer idea of what ETH - and the entire market - might do after tomorrow's FOMC meeting.
Check our Crypto Banter Discord here for updates!
Follow me on Twitter to get all the updates on my personal trading progress!
Claim your Bitget sign-up bonuses here (details below).
Chart #5 - US Dollar Currency Index (DXY) 12-Hour Chart
Chartist: Sheldon
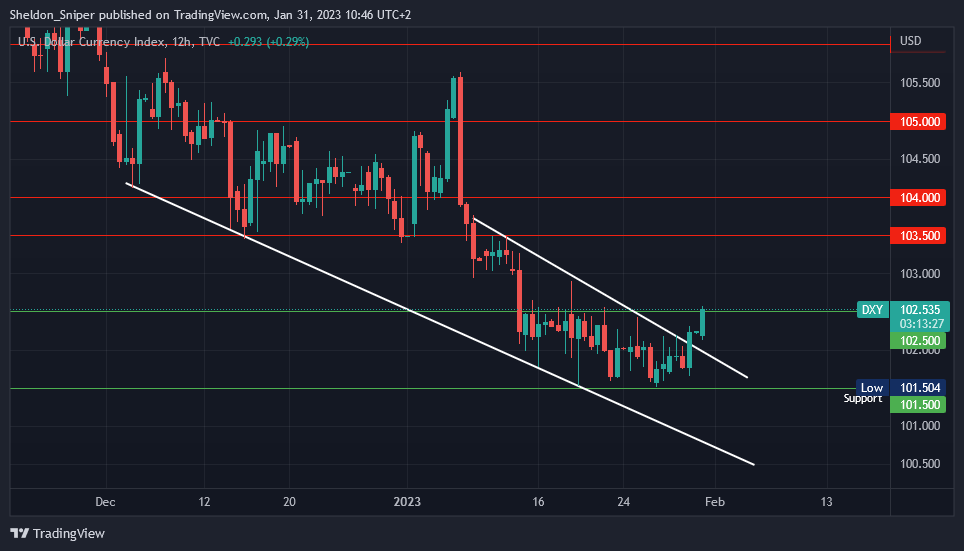
(For the chart screenshot, click here.)
The DXY started a downtrend in September and found support at 101.50 in mid-January. Since then, it has been consolidating between the 101.50 and 102.50 range. But now, it looks like it wants to push higher.
As you can see from the chart, it has broken out of its falling channel structure and moved to the top of the range at 102.50 (resistance).
If it breaks through 102.50 and moves higher, it will be bad for stocks and crypto, as money will flow out of the markets and back into the US Dollar.
Check our Crypto Banter Discord here for updates!
Follow me on Twitter for urgent updates on my trading progress!
Claim your Bitget sign-up bonuses here (details below).
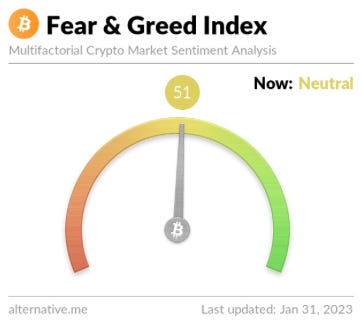
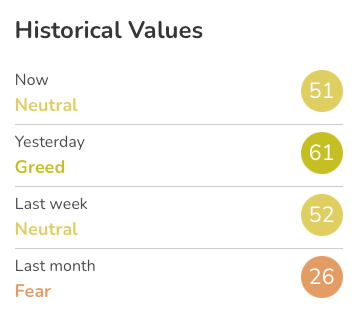
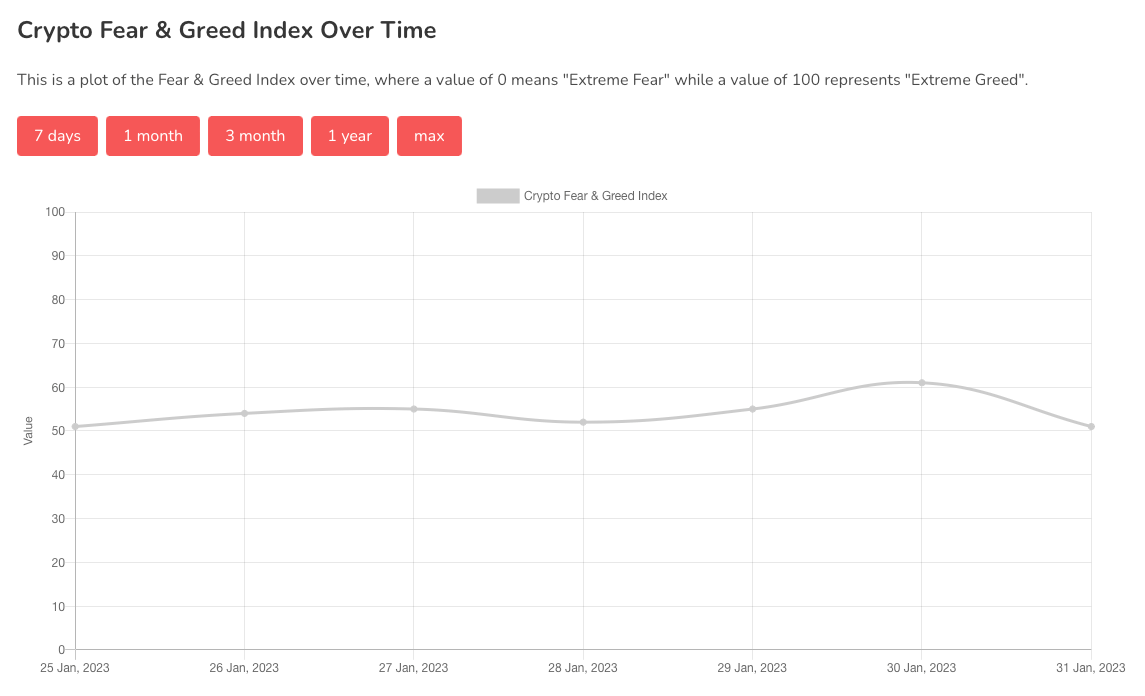
Chart #6 - Bitcoin Fear and Greed Index
The Bitcoin Fear and Greed Index is sitting at 51 today, Neutral.
The highest the index has been over the past seven days is 61, and the lowest is 51.
Overall Market Sentiment (Banter’s Take)
The market is being steered by speculators, as the pros are likely sitting it out until the FOMC results.
A 25 bps rate hike by the Fed is already priced in. But chances are high that Powell has no choice but to give a hawkish post-FOMC talk, which could lead to one more spike down.
But don’t worry. We are in this together. Make sure to join us tomorrow as we cover the FOMC.
Stay safe my friends!