

📈📉 PROFIT From The Crash With THIS SOL Trade!
📈📉 PROFIT From The Crash With THIS SOL Trade!
Is BTC Targeting $48K?
Overview
Chart #1 - Bitcoin (BTCUSDT) 12-Hour
Chart #2 - Big Time (BIGTIMEUSDT) 12-Hour
Chart #3 - Ethereum/Bitcoin (ETHBTC) Daily
Chart #4 - Solana (SOLUSDT) 12-Hour
Bear Blitz: BTC Put Spread Strategy for $62K-$61K Range
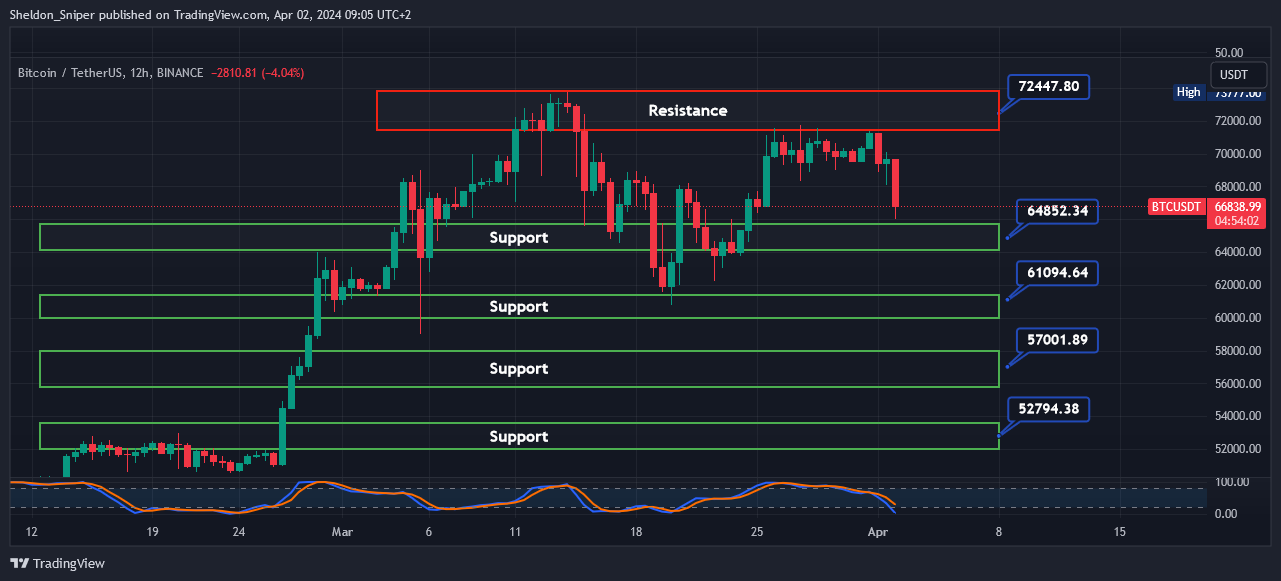
Chart #1 - Bitcoin (BTCUSDT) 12-Hour
Chartist: Sheldon
(For the chart screenshot, click here.)
This morning, BTC rejected at $71,500 and has started retracing. The price is currently trading in the $64,000 - $65,700 area of support.
I think there is further downside to come, especially after such a massive move up over the last couple of months. Also, the BTC halving is in 18 days. There has been a correction leading up to the last two halvings. This time may be the same!
If we go down, levels to watch are $61,000, $57,000, and $53,000. Long trades will only make sense again once the price stabilizes on higher time frames.
Sign-up and trade on Bybit today.
Exclusive $30,000 deposit rewards and bonuses up for grabs!
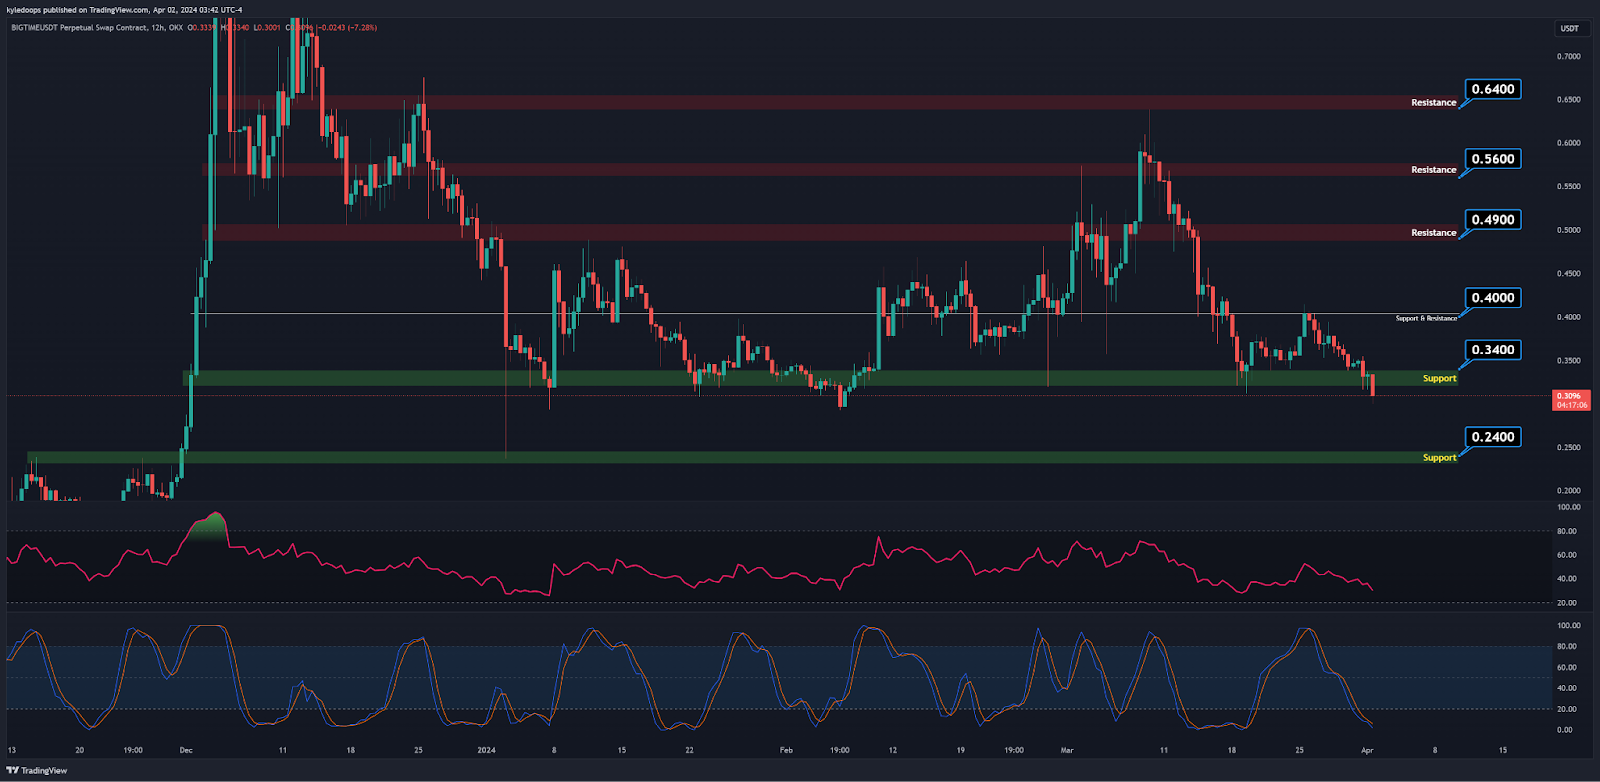
Chart #2 - Big Time (BIGTIMEUSDT) 12-Hour
Chartist: Kyle
(For the chart screenshot, click here.)
BIGTIME appears to have lost support at $0.34 and is now targeting the $0.24 support level, simultaneously filling the imbalance present on the left.
The Stochastic RSI is in the oversold area and hasn't crossed up yet.
Similarly, the RSI is at low levels where it usually reverses. Therefore, we expect it to either reclaim the current support or target the next one below, giving us plenty of time to plan our entries.
Claim your Bitget sign-up bonuses here (details below).

Outsmart 99% Of The Market!
Get full access into our Discord And Telegram group, where you'll find all of our premium content!
👉 Trade Signals!
👉 Trade Set-Ups!
👉 Trading Challenges!
👉 Education!
👉 SO MUCH MORE!
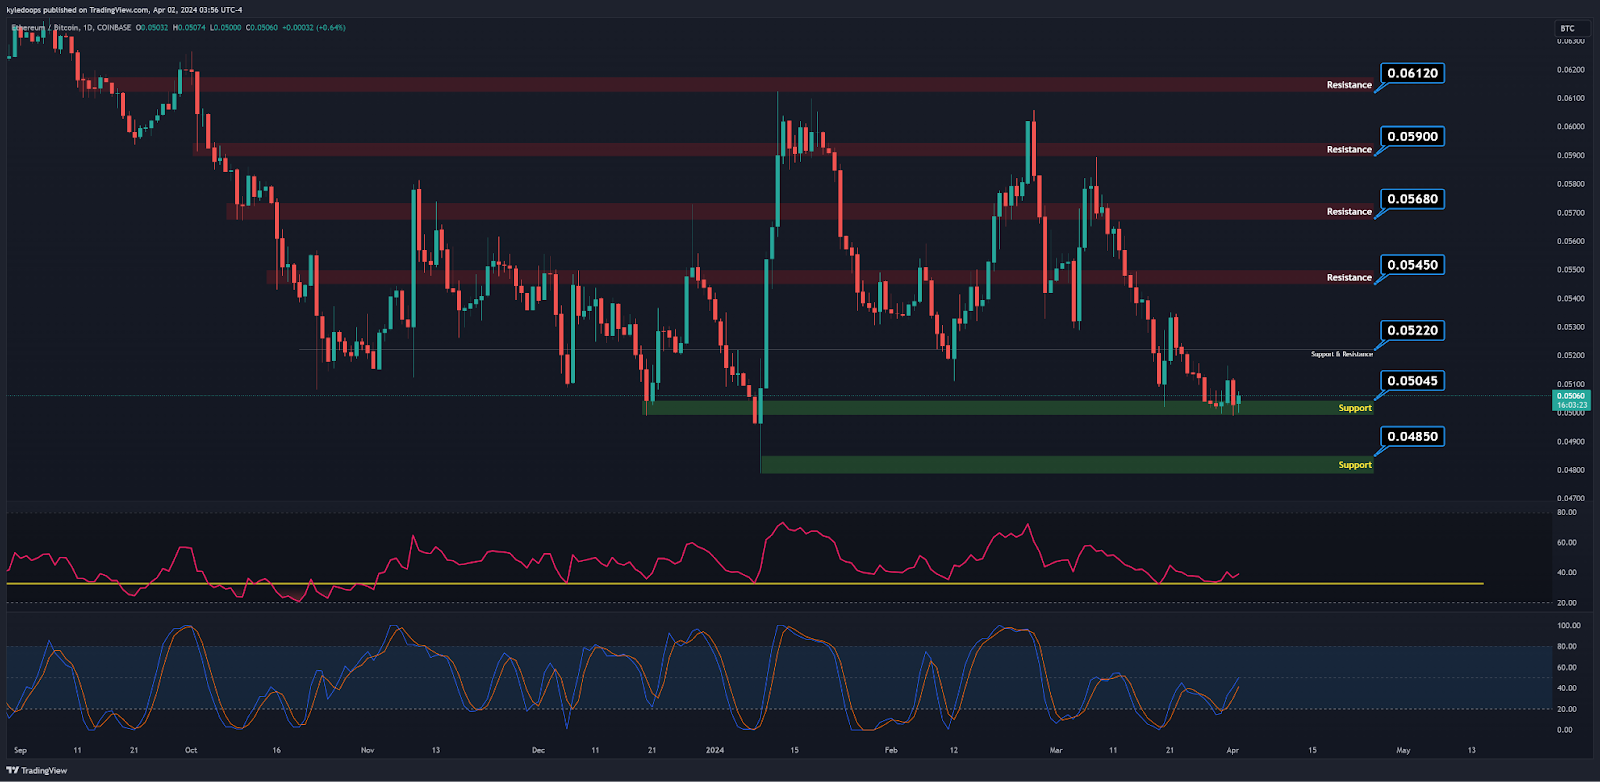
Chart #3 - Ethereum/Bitcoin (ETHBTC) Daily
Chartist: Kyle
(For the chart screenshot, click here.)
Is alt season on the way?
Currently, ETH is sitting at a support level of 0.050, possibly building structure. At the same time, the Stochastic RSI and RSI have printed bullish divergences on the daily and 12-hour charts.
We'll monitor the situation closely and plan our trades accordingly.
Claim your Bitget sign-up bonuses here (details below).
Chart #4 - Solana (SOLUSDT) 12-Hour
Chartist: Sheldon

(For the chart screenshot, click here.)
Crypto is retracing; therefore, we are not looking for any long trades at the moment. However, once the price of Bitcoin stabilizes, there is generally a massive oversold bounce in coins that have been performing well prior to the drop. These oversold bounces can be very quick, and there is good money to be made if played correctly.
SOL is one of the coins that has performed very well over the last couple of months and could bounce hard once the price of BTC finds support.
Entry: Areas that I will be looking for an entry are at:
1st: $165 - $180
2nd: $120 - $140
Take Profit (TP): At the resistance areas above where we have entered, with for example the current resistance being at $200 - $220
Stop Loss: We’ll allow for a 5% - 10% stop loss below our entry.
Claim your Bitget sign-up bonuses here (details below).
Bear Blitz: BTC Put Spread Strategy for $62K-$61K Range: Anand's 2nd April Trade
Anand is our good friend from Deribit and will be providing us with a Deribit Options Trade set up each day!
Check it out!
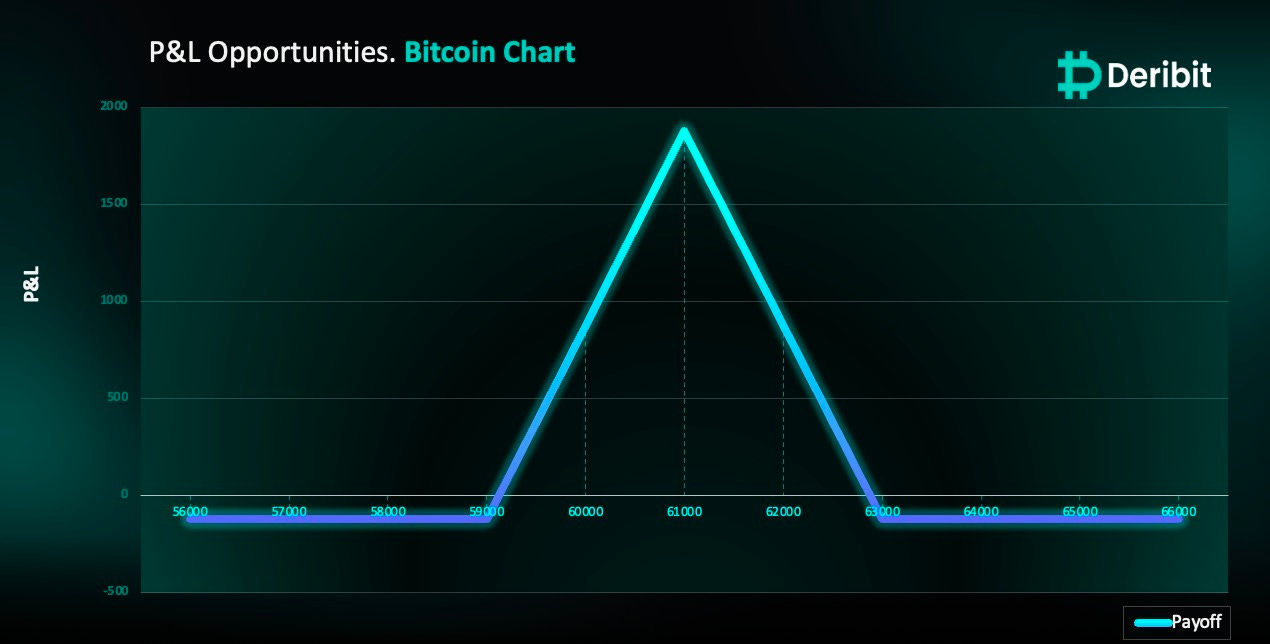
In a bearish BTC market aiming for $62,000 to $61,000 levels, here's a trading approach for short-term gains with Put Butterfly Spread of brief expiry.
Bitcoin ETF inflows showed weakness on Monday, accompanying a market sell-off. Critical support levels at $68,300 were breached, alongside the price also broke through the 4-hour demand zone at $66,300. The next significant support zone is anticipated around $62,000-$61,000.
Trade Structure
(OTM Put) Buy 1x BTC-5APR24-63,000-P @ $450
(OTM Put) Sell 2x BTC-5APR24-61,000-P @ $225
(OTM Put) Buy 1x BTC-5APR24-59,000-P @ $120
Payouts
Maximum Profit: $1,880/BTC
Debit of Strategy: $120/BTC
If the Bitcoin price is at $61,000 when the options expire on April 5th, traders will achieve maximum profit from this strategy.
Banter’s Take
Bitcoin is still in a correction phase. On the Larger Time Frames (LTFs), it has printed a lower high and is aiming for the previous lows at $61,000. The question now is: will it print a higher low and give us a flag, or will it print a lower low and confirm a full reversal action targeting lower levels such as $48,000? This is the time to be patient and monitor our levels. We won't jump to any conclusions until we get confirmations. We are not yet bearish.
Stay safe my friends!
Go to our Crypto Banter Discord here where Sheldon and Kyle give updates on the charts and trades from The Daily Candle newsletter!