

📈📉PULLBACK! Did Bears WIN? Or Do We BUY the DIP?
📈📉PULLBACK! Did Bears WIN? Or Do We BUY the DIP?
Bears are celebrating Bitcoin's rejection. BUT, it's not over yet!
Overview
Chart #1 - Cardano (ADAUSDT) Daily Chart
Chart #2 - Bitcoin (BTCUSD) Hourly Chart
Chart #3 - Ethereum (ETHUSD) Hourly Chart
Chart #4 - Chainlink (LINKUSDT) Daily Chart
Chart #5 - Fear and Greed Index

Chart #1 - Cardano (ADAUSDT) Daily Chart
Chartist: Sheldon
(For the chart screenshot, click here.)
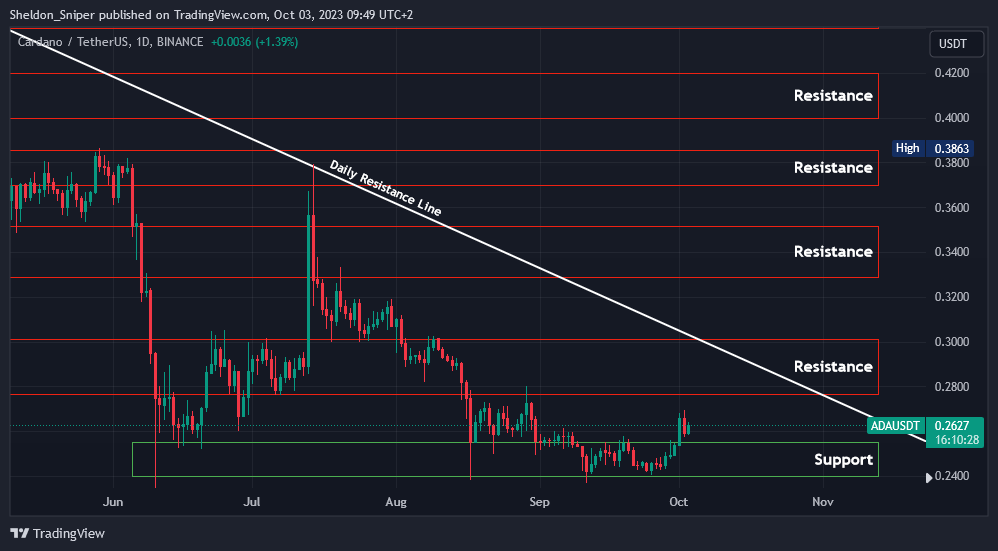
ADA has rallied by 12.5% over the last week, going from the $0.24 level of support up to $0.27, before hitting resistance yesterday. It then retraced to its current trading price of around $0.2630.
I think ADA might retrace from here down to the next support level at $0.26 before we could possibly see another leg up to test the next area of resistance starting at around $0.2780.
The descending resistance line, which originates from the middle of April, also intersects in the same area, at around $0.29, and will act as additional resistance if the price reaches there.
Sign-up and trade on Bybit today.
Exclusive $30,000 deposit rewards and bonuses up for grabs!
Chart #2 - Bitcoin (BTCUSD) Hourly Chart
Chartist: Kyle
(For the chart screenshot, click here.)
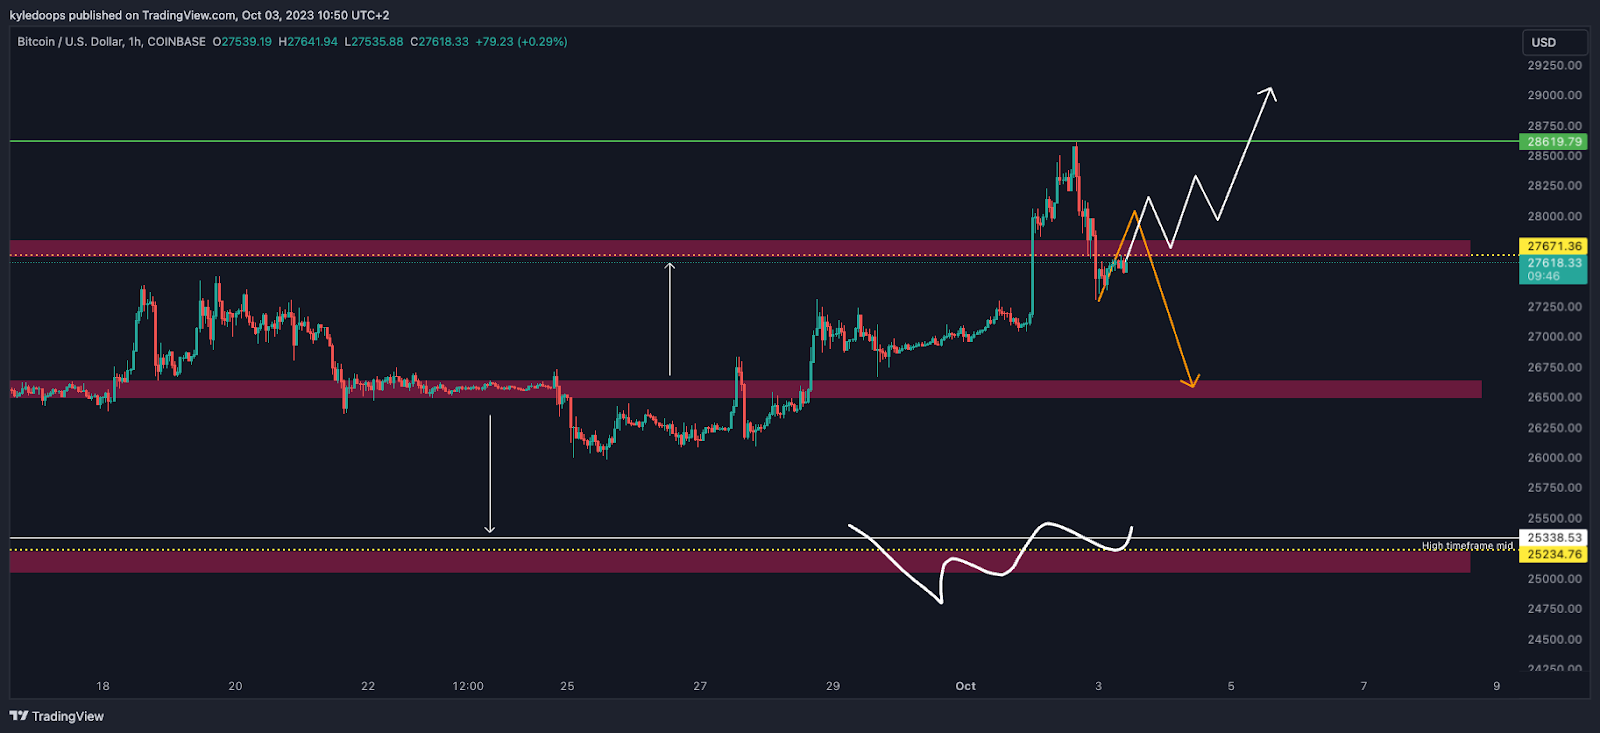
Bitcoin created a higher high and broke above the top side of the range but has since reentered the range.
Now, traders should be on alert for one of two scenarios.
First, the orange path: if the price sets a lower high and then reenters the range, this would confirm the deviation. Consequently, we can short down to $26,500 as the first target and then $25,228 as the second target.
Alternatively, as indicated by the white lines, if there's a reclaim of the range high, this would signify a consolidation above $27,600, followed by another upward attempt.
Claim your Bitget sign-up bonuses here (details below).
Chart #3 - Ethereum (ETHUSD) Hourly Chart
Chartist: Kyle
(For the chart screenshot, click here.)
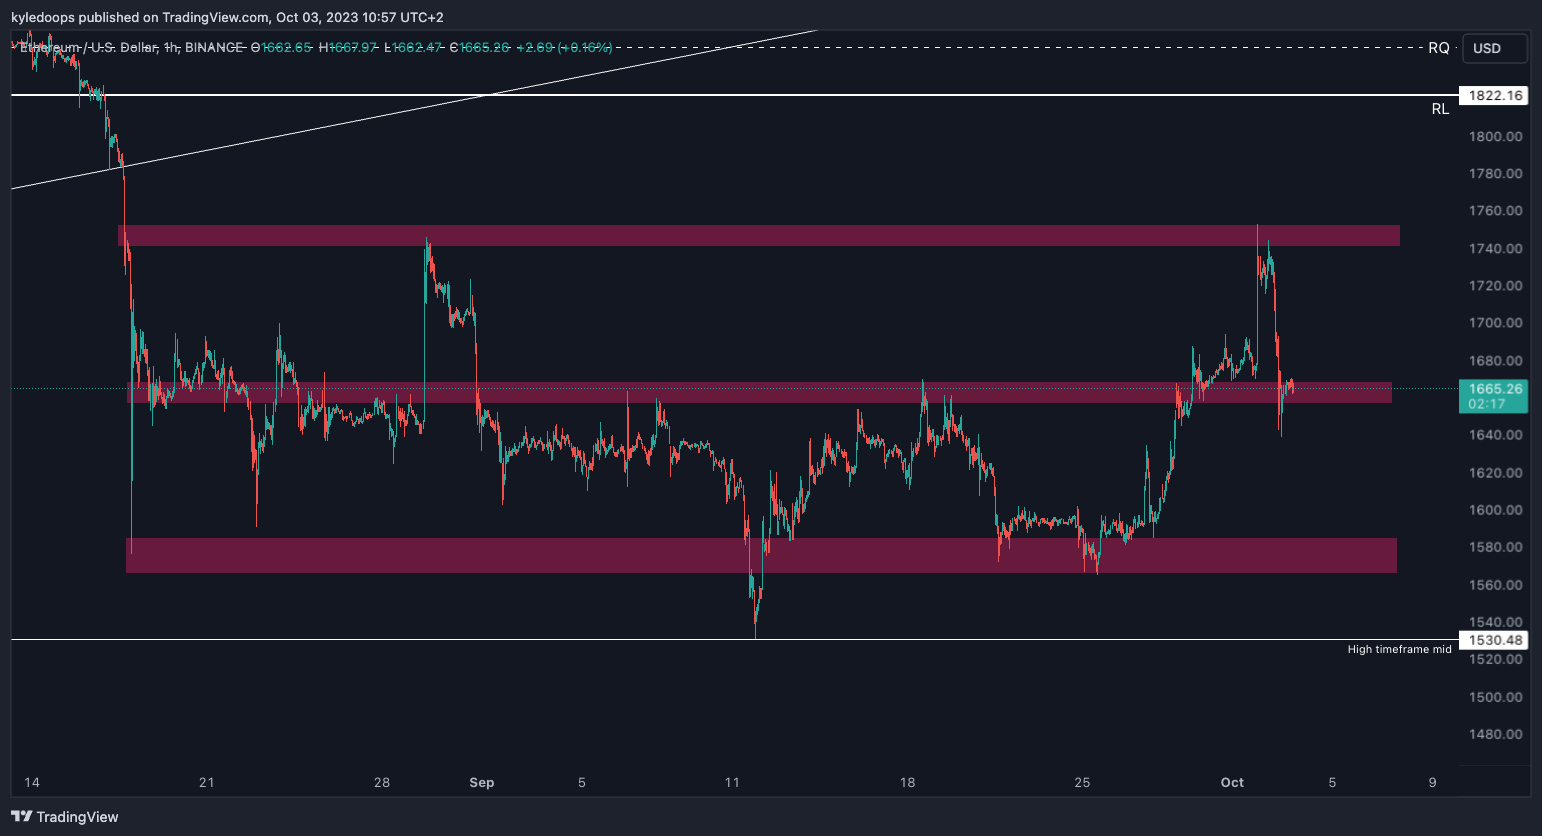
This is our ETH range.
The price tagged the top side with an immediate rejection from $1,760 and then returned to the mid-range at $1,665, which is currently holding as support.
After significant moves, it's essential to let the market digest what occurred and consolidate. If it maintains this level for a few hours, then its movement will align with Bitcoin's.
In other words, if BTC goes up, ETH will likely target the range high again.
Claim your Bitget sign-up bonuses here (details below).
Chart #4 - Chainlink (LINKUSDT) Daily Chart
Chartist: Sheldon
(For the chart screenshot, click here.)
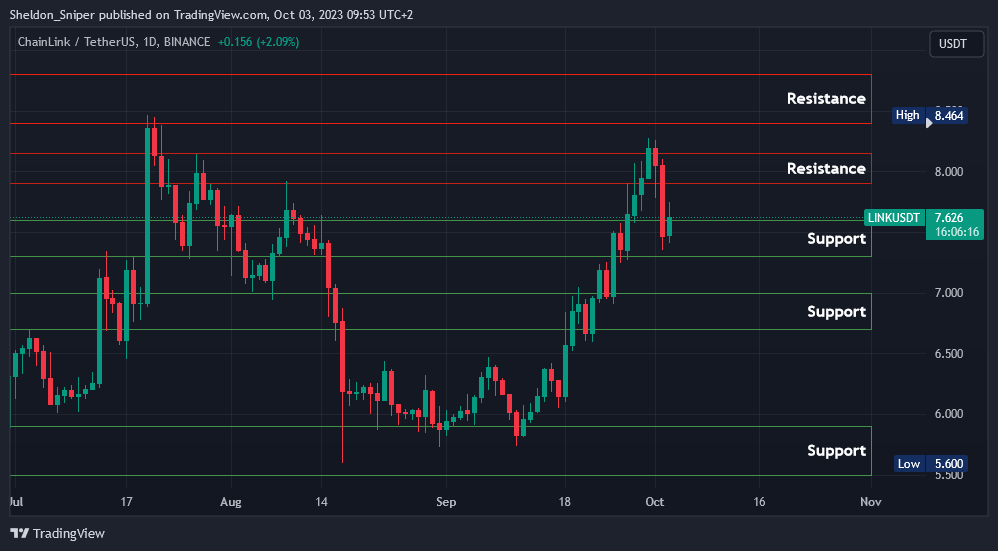
LINK is at $7.60.
If the $7.30 - $7.60 area can hold as support, then I believe it might make another move to the upside, testing the $8.40 - $8.80 area of resistance.
This is the same area that was last tested in the middle of July.
Claim your Bitget sign-up bonuses here (details below).
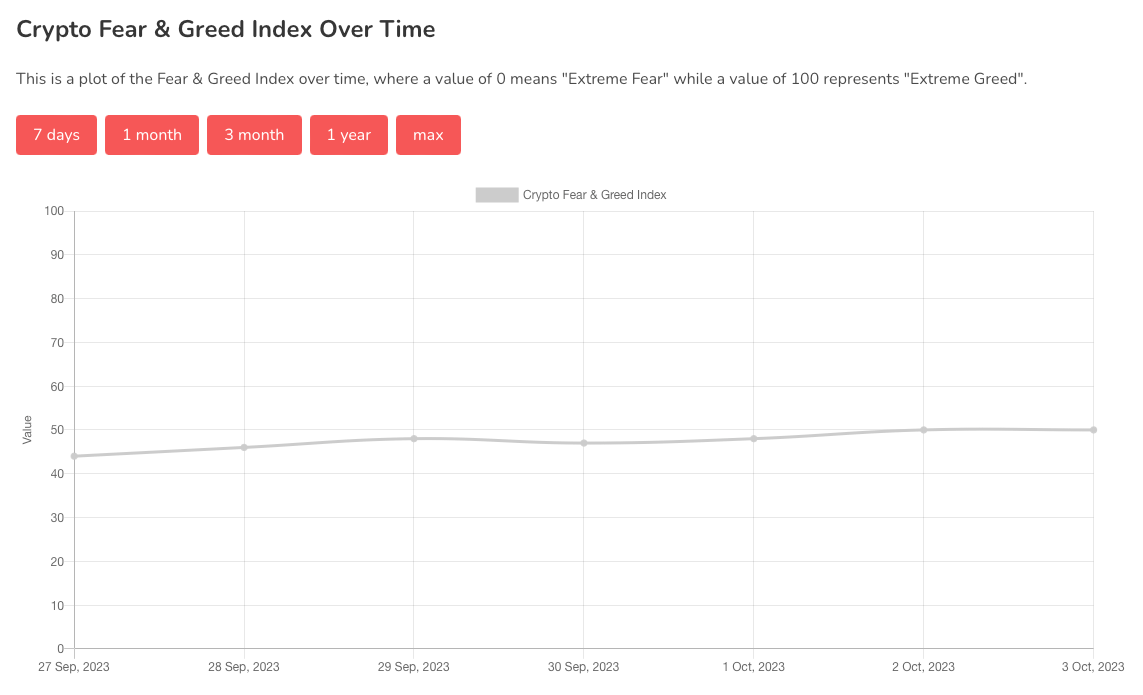
Chart #5 - Fear and Greed Index
The Fear and Greed Index is sitting at 50 today, Neutral.
The highest the index has been over the past seven days is 50, and the lowest is 44.
Banter’s Take
Most bears are celebrating Bitcoin's rejection from the 200-day MA and 200-week MA. However, it's not over yet. There was a break in structure with a higher high and two prior higher lows. This suggests that this pullback could represent the next higher low, potentially offering a buying opportunity.
Stay safe my friends!
Go to our Crypto Banter Discord here where Sheldon and Kyle give updates on the charts and trades from The Daily Candle newsletter!