

📈📉 PUMP! THIS is Our NEXT Bitcoin Target!
📈📉 PUMP! THIS is Our NEXT Bitcoin Target!
If BTC closes above HERE today, things will be looking good!
Overview
Chart #1 - Crypto Total Market Cap (TOTAL) Daily
Chart #2 - Bitcoin (BTCUSD) Daily
Chart #3 - Bitcoin Dominance (BTC.D) Weekly
Chart #4 - Cardano (ADAUSDT) Daily
Chart #5 - Fear and Greed Index

Chart #1 - Crypto Total Market Cap (TOTAL) Daily
Chartist: Sheldon
(For the chart screenshot, click here.)
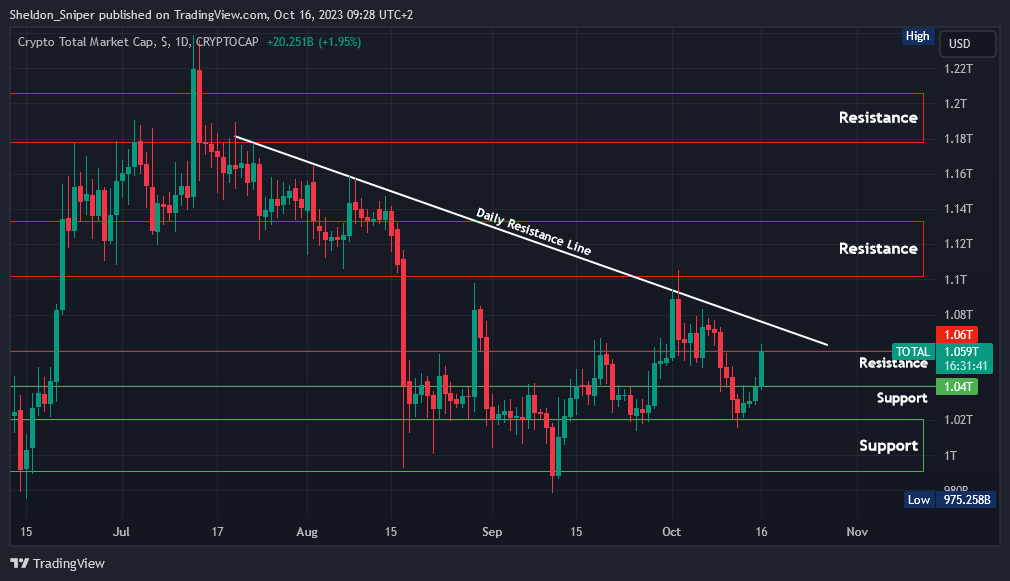
Over the last couple of days, the TOTAL has made a decent move to the upside, going from the $1.02T level of support to where it is currently trading at $1.06T, which is also a level of resistance.
The price could either consolidate in this area or retrace down to test lower support levels before possibly moving higher.
If it can break through $1.06T, then the next resistance is the descending line that originates from the middle of July, at around $1.08T which, if broken, could lead to $1.1T.
Sign-up and trade on Bybit today.
Exclusive $30,000 deposit rewards and bonuses up for grabs!
Chart #2 - Bitcoin (BTCUSD) Daily
Chartist: Kyle
(For the chart screenshot, click here.)
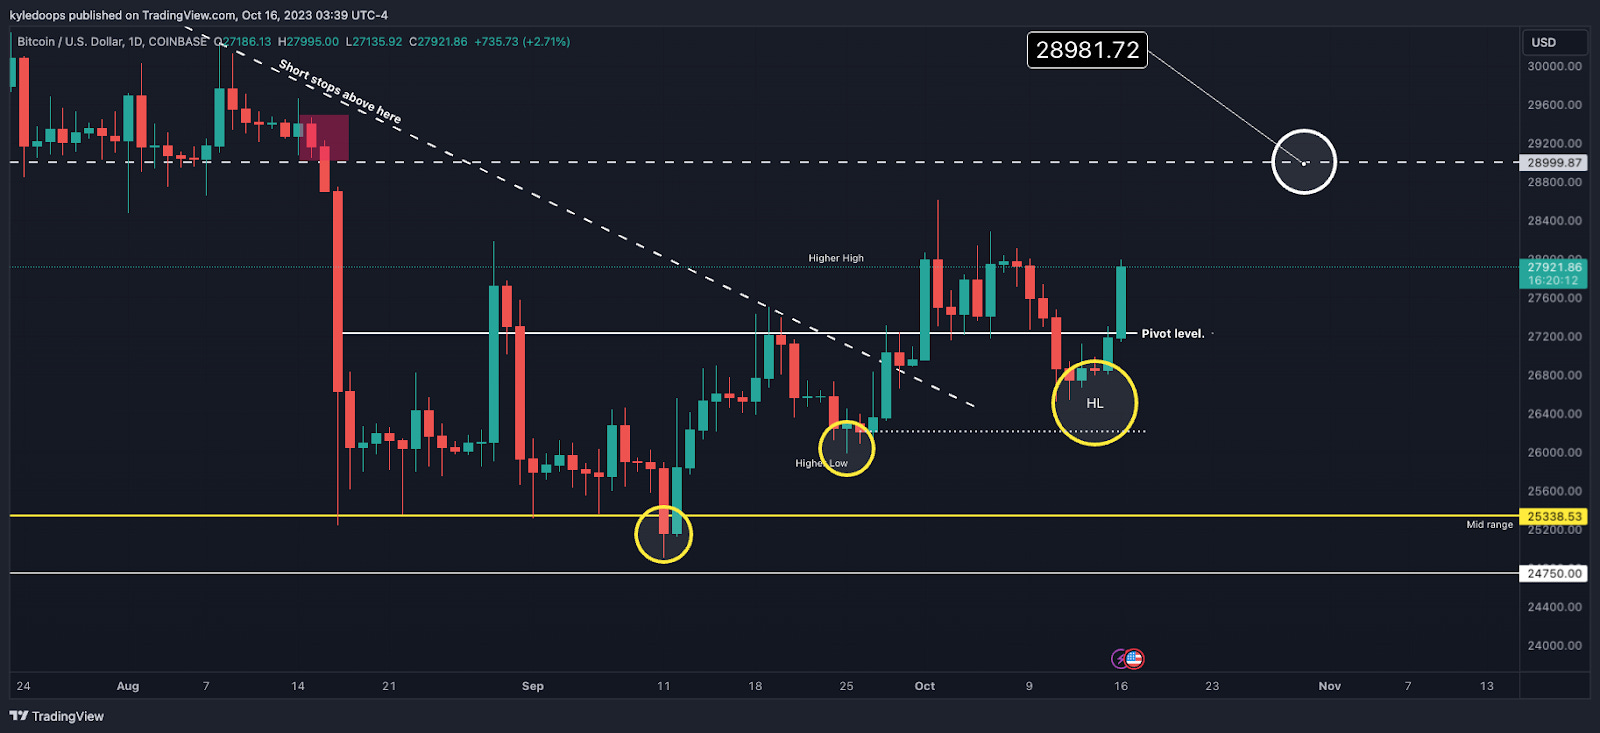
Last week, we outlined that traders should be watching for a higher low to form within the yellow circle, with full invalidation with any closes below the prior closing lows at $26,208.
This means that at this rate, this is now more than likely confirmed as the next higher low, especially since it has reclaimed the pivot level.
So, the next intended target is $29,000.
The daily close will provide plenty of information!
Claim your Bitget sign-up bonuses here (details below).
Chart #3 - Bitcoin Dominance (BTC.D) Weekly
Chartist: Kyle

(For the chart screenshot, click here.)
Bitcoin dominance continues to push up and is attempting to break above the 200-week MA, as well as the prior highs.
A reminder that this comes off a breakout of a high-timeframe range, which means the breakout will be significant once the price gets above 51.56%.
Claim your Bitget sign-up bonuses here (details below).
Chart #4 - Cardano (ADAUSDT) Daily
Chartist: Sheldo
(For the chart screenshot, click here.)
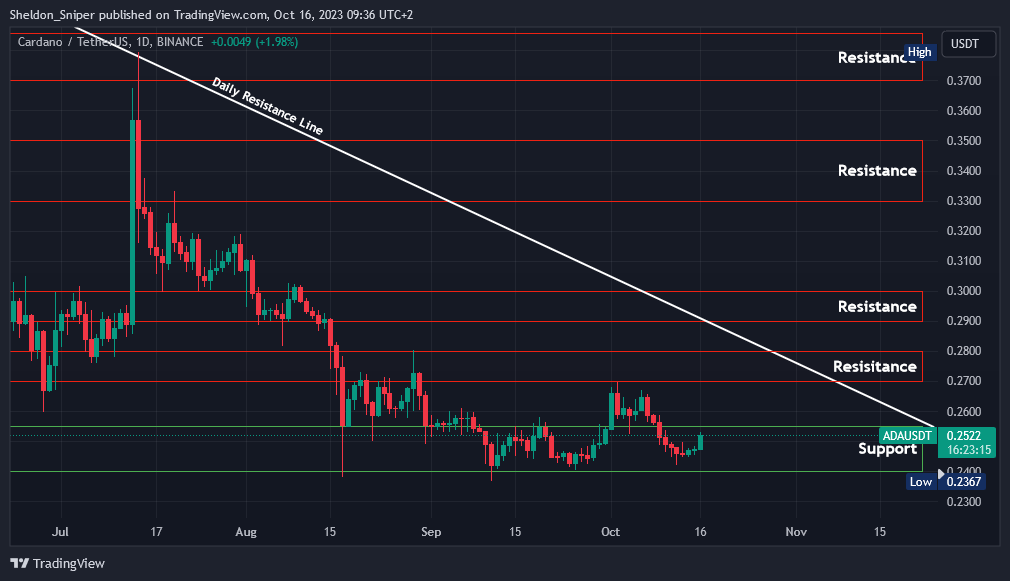
ADA has been consolidating and ranging in the $0.24 - $0.2550 area.
The price is currently at just over $0.25, and with the market showing some bullish intent over the last few days, ADA could move up from here to once again test the next area of resistance at $0.27 - $0.28.
The descending resistance line from April also intersects at $0.28. If it can break both the $0.27 - $0.28 area of resistance and the trend line, the next area of resistance is at $0.29 - $0.30.
Claim your Bitget sign-up bonuses here (details below).
Chart #5 - Fear and Greed Index
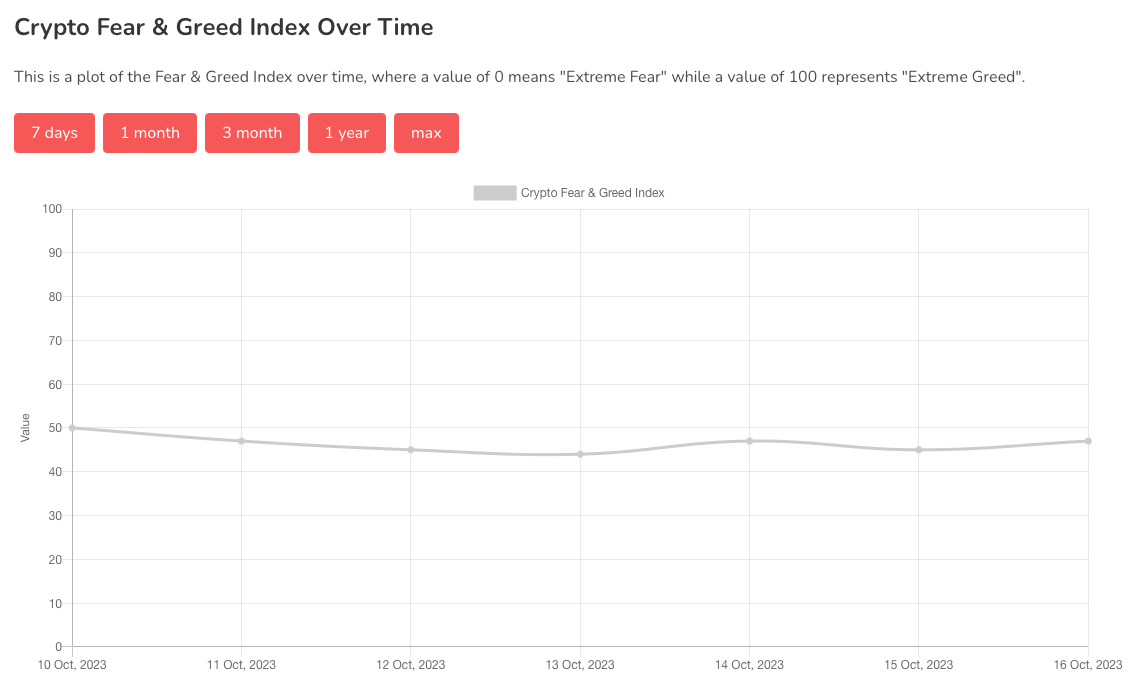
The Fear and Greed Index is sitting at 47 today, Neutral.
The highest the index has been over the past seven days is 50, and the lowest is 44.
Banter’s Take
Bulls struck just as hope was being lost, but there are still some key levels to clear, and optimists will need to wait for the close. If it closes above $28,000 today, things will be looking good since the price would clear the 200 MA on the daily, and then challenge the 200 weekly MA too.
Stay safe my friends!
Go to our Crypto Banter Discord here where Sheldon and Kyle give updates on the charts and trades from The Daily Candle newsletter!