

📈📉 Pyth Network (PYTH) Long Trade Setup!
📈📉 Pyth Network (PYTH) Long Trade Setup!
PLUS: Is Bitcoin Still in a Downtrend?
Overview
Chart #1 - Crypto Total Market Cap (TOTAL) Daily
Chart #2 - Celestia (TIAUSD) Daily
Chart #3 - Pyth Network (PYTHUSD) 4-Hour
Chart #4 - Solana (SOLUSDT) Daily
Chart #5 - Fear and Greed Index
Chart #1 - Crypto Total Market Cap (TOTAL) Daily
Chartist: Sheldon
(For the chart screenshot, click here.)
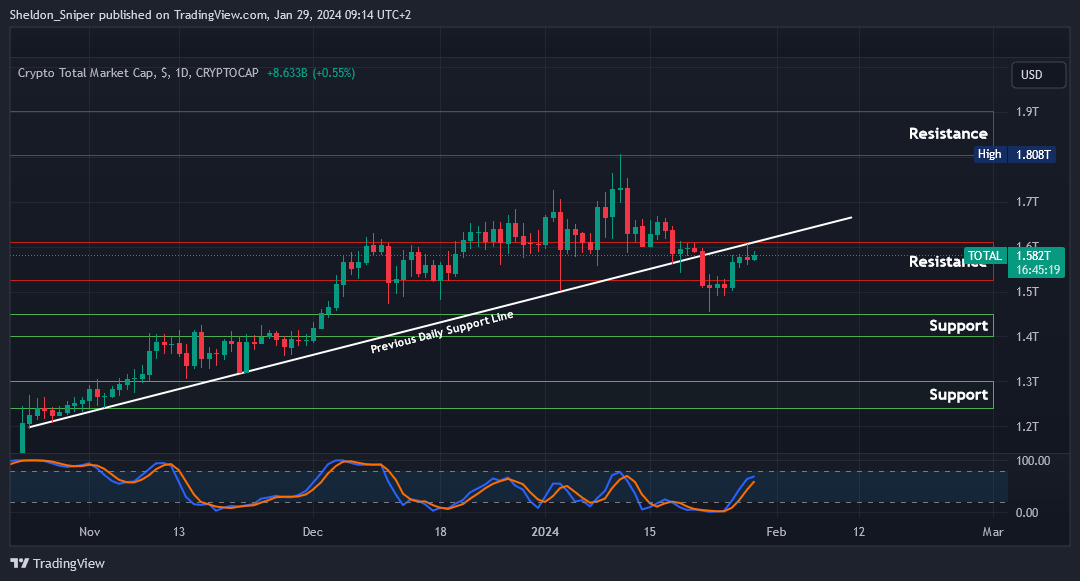
The TOTAL is once again trading at resistance, and is also retesting the previous support line at $1.6T.
If the TOTAL gets rejected here, I expect to see $1.52T, maybe even $1.4T - $1.45T.
If it breaks through $1.6T, the next area of resistance is at $1.8T - $1.9T, which was tested earlier in the month.
Sign-up and trade on Bybit today.
Exclusive $30,000 deposit rewards and bonuses up for grabs!
Chart #2 - Celestia (TIAUSD) Daily
Chartist: Kyle
(For the chart screenshot, click here.)
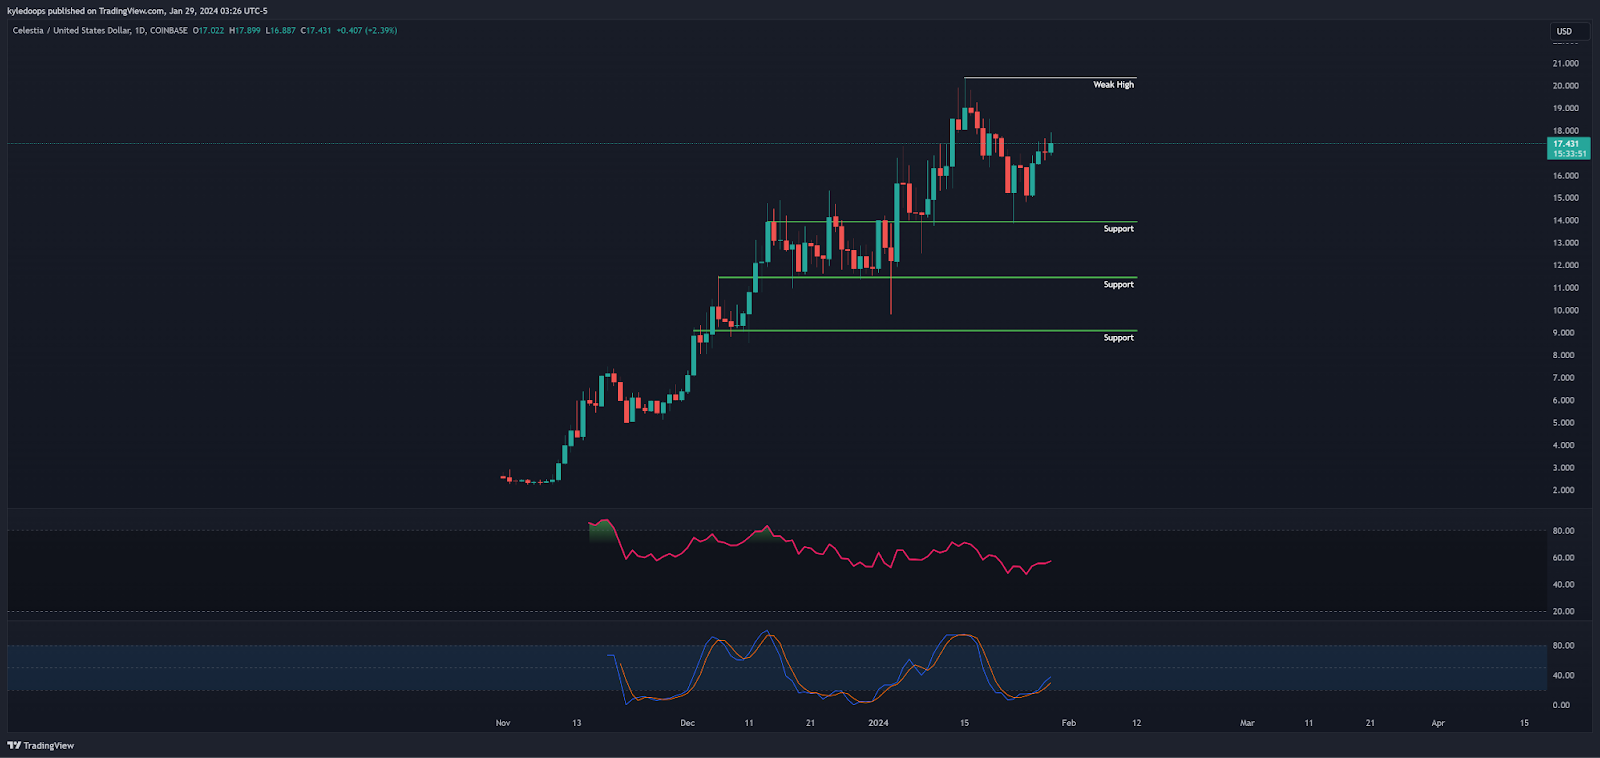
While the majority of the market is in a clear downtrend and retracing, TIA is on its own course, continuously printing higher lows and higher highs with the latest support at $14.
The next resistance, marked as a weak high, is at $20.30.
There is a small local resistance at $18 that may force the price close to support, presenting a new opportunity for a long entry.
Otherwise, we’ll wait for the new support after breaking resistance.
Claim your Bitget sign-up bonuses here (details below).

Outsmart 99% Of The Market!
Get full access into our Discord And Telegram group, where you'll find all of our premium content!
👉 Trade Signals!
👉 Trade Set-Ups!
👉 Trading Challenges!
👉 Education!
👉 SO MUCH MORE!
Chart #3 - Pyth Network (PYTHUSD) 4-Hour
Chartist: Kyle
(For the chart screenshot, click here.)
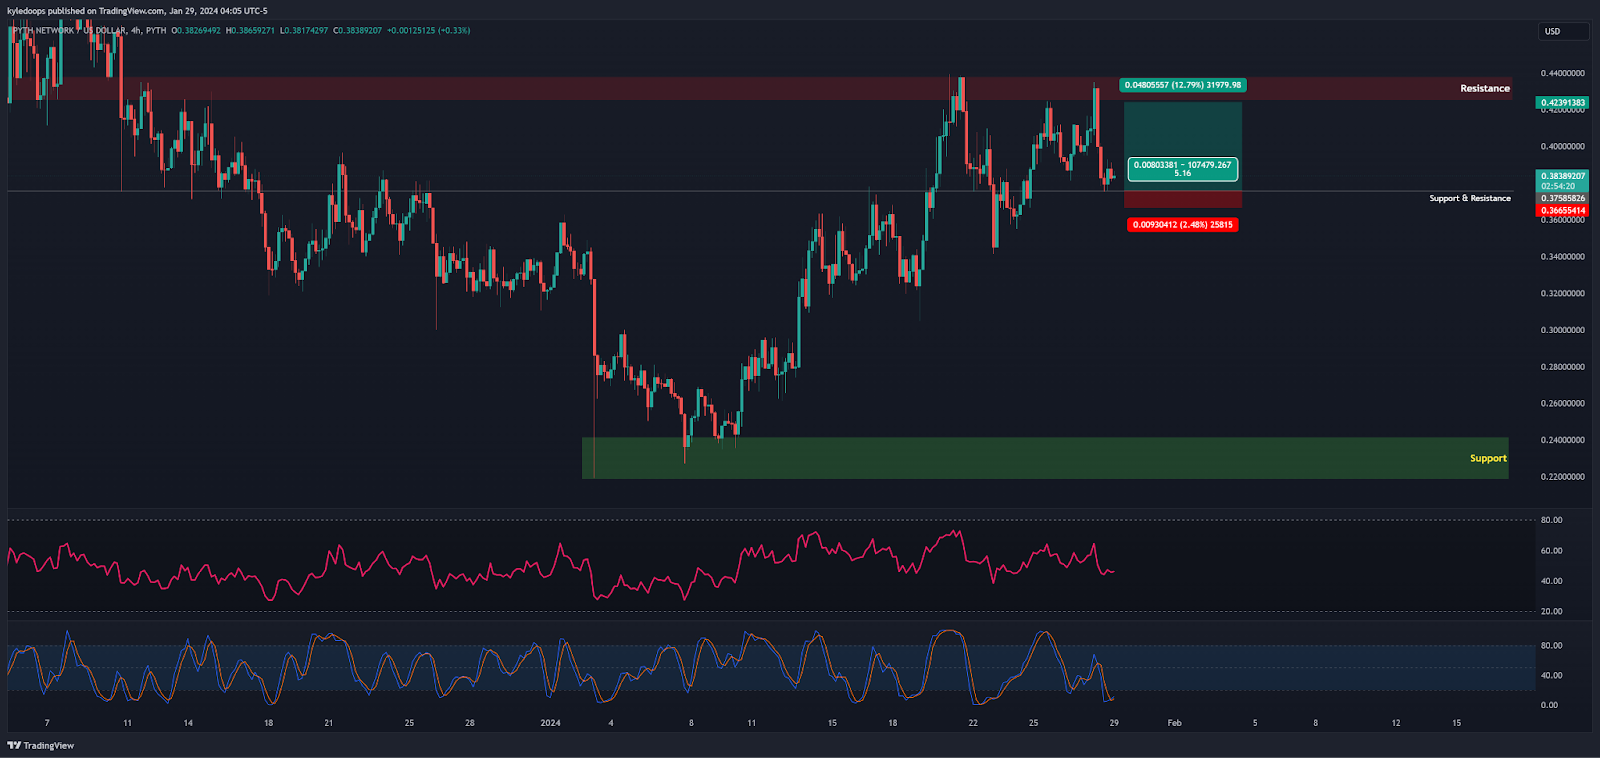
PYTH is another example of a strong coin (price action-wise).
It's at support right now, offering an opportunity for a long entry with a Risk-Reward Ratio (RRR) of 1:5:
Entry at $0.38.
My target is $0.42.
And my stop loss is approximately 2.5%, so leverage is minimal (depending on your risk management protocol). I’ll enter in portions to minimize risk.
The final target is almost 13%.
Claim your Bitget sign-up bonuses here (details below).
Chart #4 - Solana (SOLUSDT) Daily
Chartist: Sheldon
(For the chart screenshot, click here.)
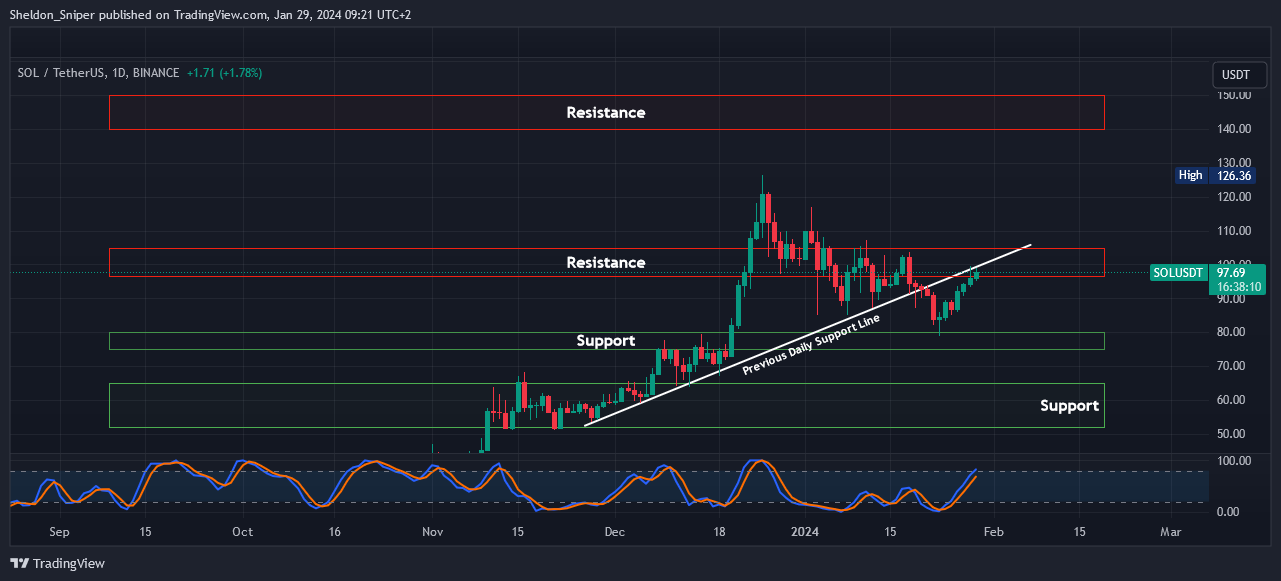
Solana news has been bullish this week…
But looking at the chart, it currently does not look too bullish!
After finding support last week, at around $80.00, it moved up to the next area of resistance at $97.00 - $105.00. If it gets rejected here, there is a possibility of further downside, with the next area of support being at $76.00 - $80.00.
If it breaks through $105.00, it could reach $140.00 - $150.00.
Claim your Bitget sign-up bonuses here (details below).
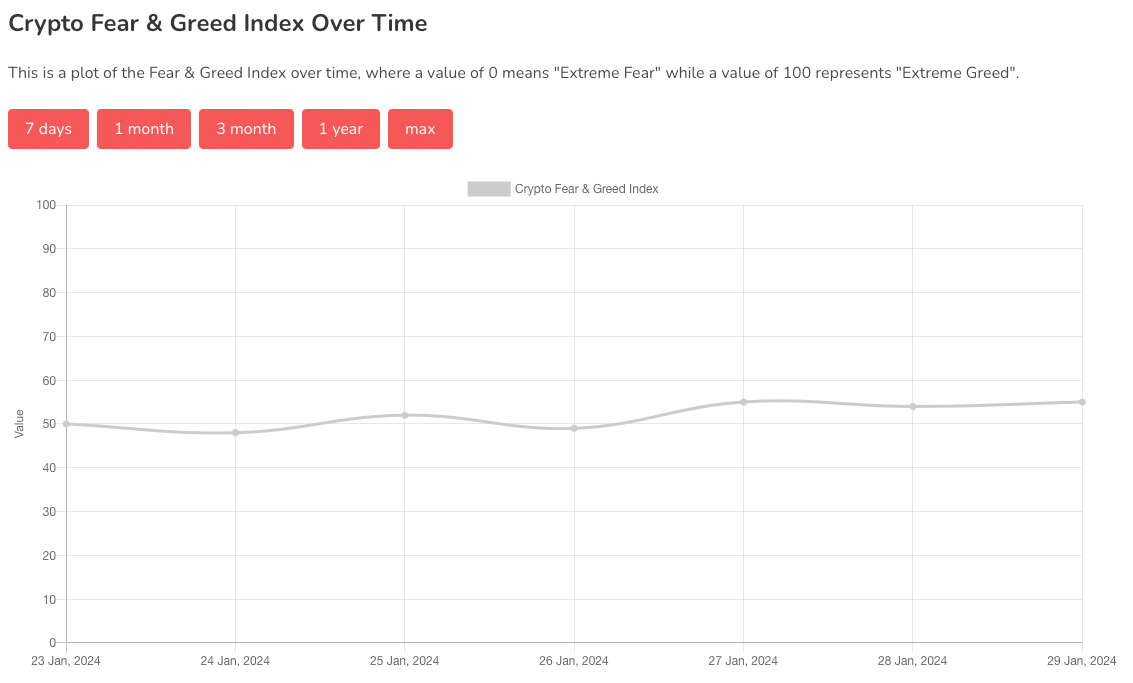
Chart #5 - Fear and Greed Index
The Fear and Greed Index is sitting at 55 today, indicating Greed.
The highest the index has been over the past seven days is 55, and the lowest is 48.
Banter’s Take
After the weekend rally from $40,000 to $42,000, Bitcoin is currently back inside the old range of $40,200 - $44,400.
Today, there is no significant volatility in the market, so while Bitcoin consolidates, it provides an opportunity for altcoins to move. It's important to note that, technically, Bitcoin is in a downtrend with nearly equal highs.
Stay safe my friends!
Go to our Crypto Banter Discord here where Sheldon and Kyle give updates on the charts and trades from The Daily Candle newsletter!