

📈📉 RNDR 600% Surge + ETH to Outshine BTC?
📈📉 RNDR 600% Surge + ETH to Outshine BTC?

Overview
Chart #1 - Render (RNDRUSDT) Daily Chart
Chart #2 - Bitcoin (BTCUSD) Daily Chart
Chart #3 - Ethereum vs Bitcoin Ratio (ETHBTC) Daily Chart
Chart #4 - Chainlink (LINKUSDT) 8-Hour Chart
Chart #5 - Fear and Greed Index

Chart #1 - Render (RNDRUSDT) Daily Chart
Chartist: Sheldon

(For the chart screenshot, click here.)
RNDR has currently found support at $1.60, and at the same time, is testing the daily descending resistance line that has been in place since the beginning of June.
The price is hovering at around $1.70. A breakout from this level could push the price to the next resistance at $1.90, or even as high as $2.00 - $2.20.
If $1.60 is lost, $1.20 and $1.40 are the next targets.
RNDR has surged by over 600% in the first six months of 2023 and could be gearing up for its next ascent.
Sign-up and trade on Bybit today.
Exclusive $30,000 deposit rewards and bonuses up for grabs!
Chart #2 - Bitcoin (BTCUSD) Daily Chart
Chartist: Kyle
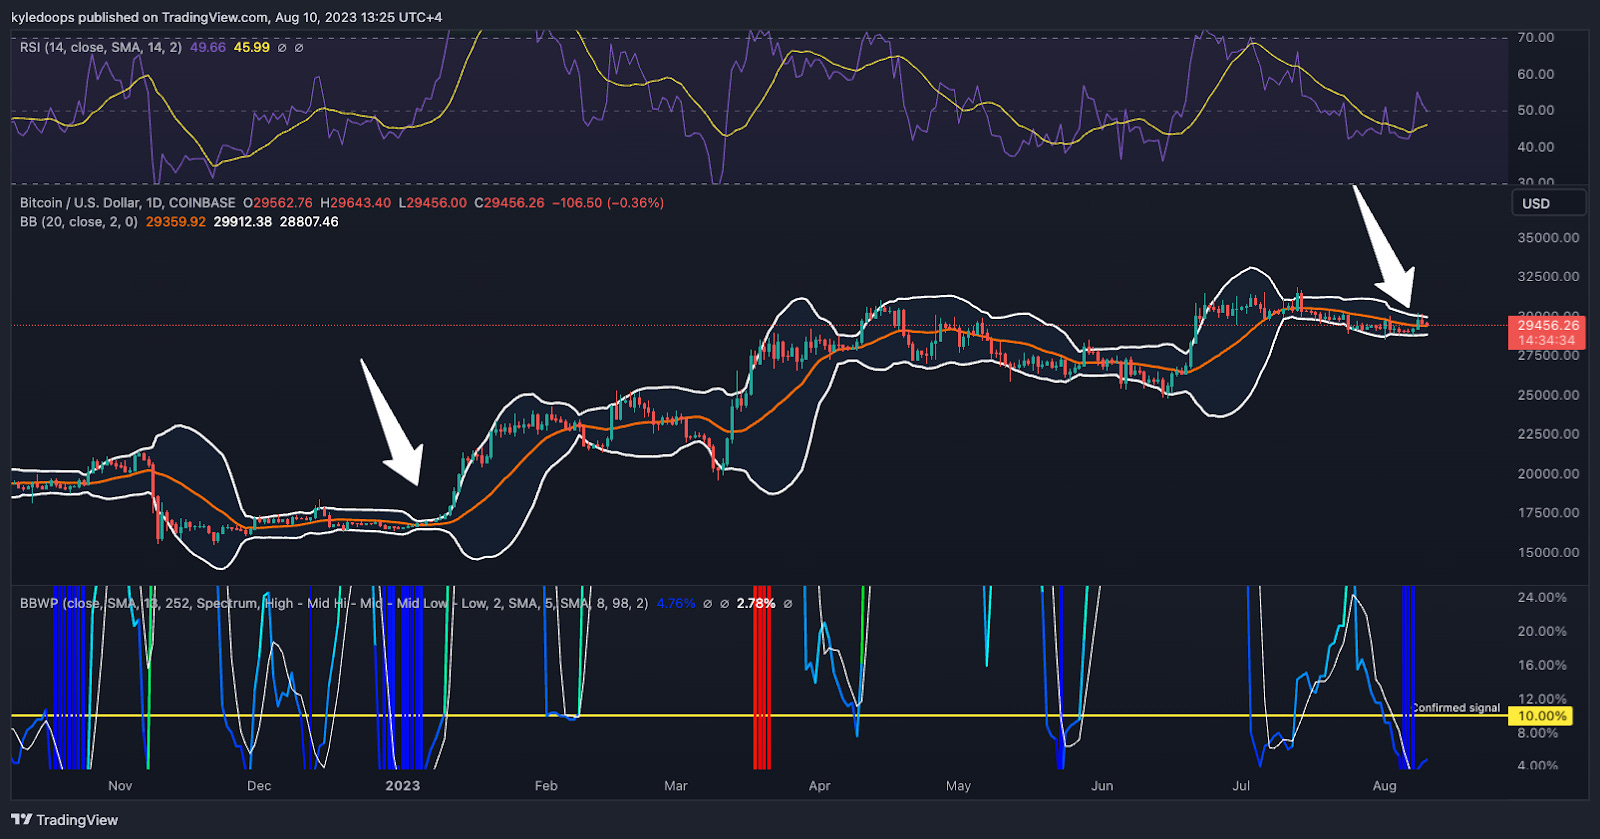
(For the chart screenshot, click here.)
Bitcoin is experiencing volatility levels reminiscent of those in January, which resulted in a price swing of over 70%.
The objective of this analysis is to monitor the lower panel chart for a surge above the 10% threshold, coupled with an upward RSI inclination. This would signify a probable upward momentum.
Should this scenario unfold, it would undoubtedly confirm the next higher low, indicating a likely upward continuation.
𝗣𝗿𝗶𝗺𝗲 𝗫𝗕𝗧
Sign up for a new Trading Account on Prime XBT!
Receive a deposit bonus of up to $7,000 with promo code: KyleDoops

Sign up for a new Trading Account on Prime XBT!
Receive a deposit bonus of up to $7,000 with promo code: SheldonSniper
Chart #3 - Ethereum vs Bitcoin Ratio (ETHBTC) Daily Chart
Chartist: Kyle
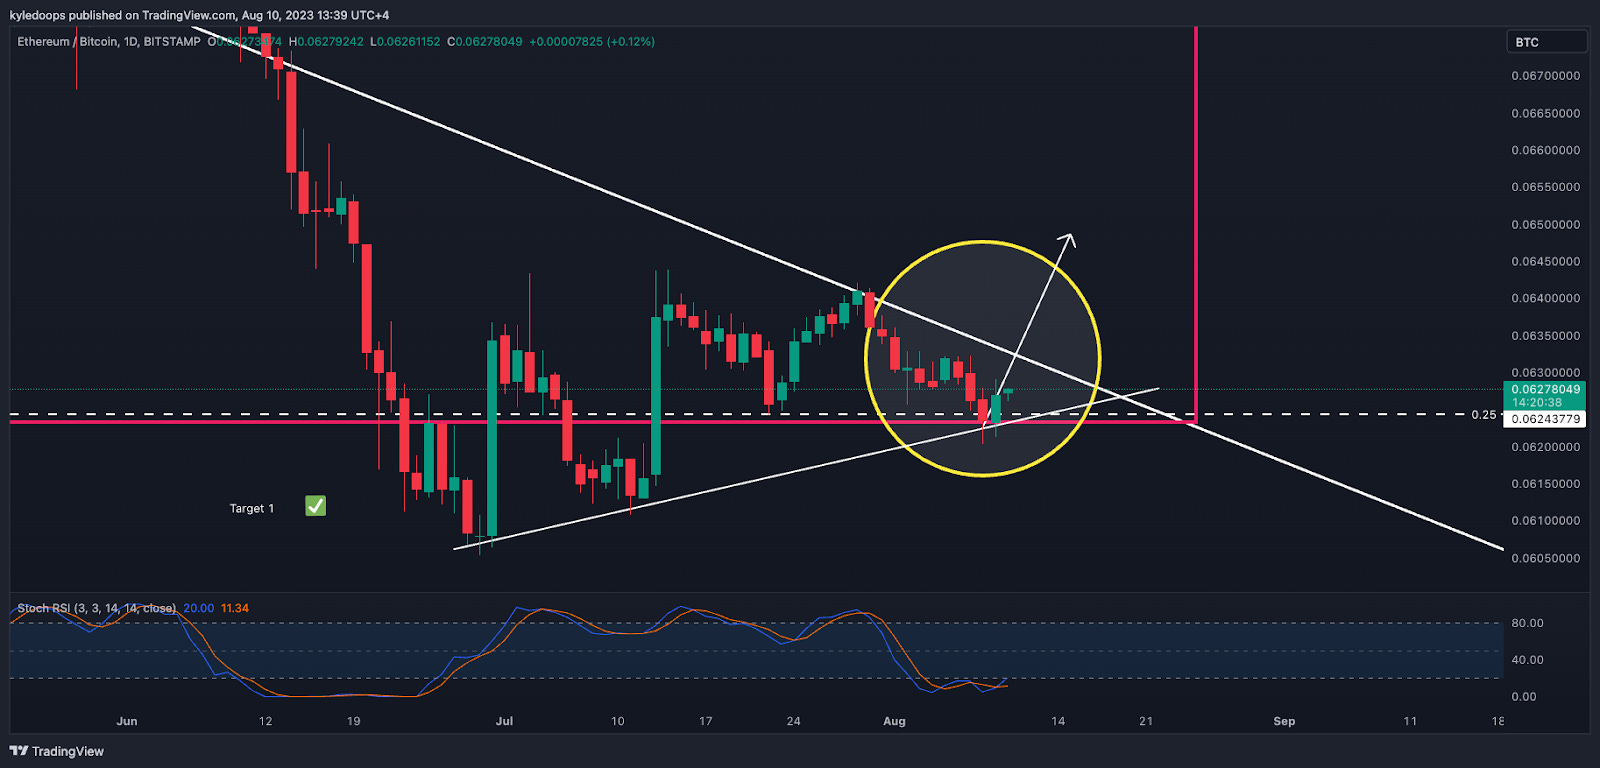
(For the chart screenshot, click here.)
ETH/BTC might breach a crucial threshold soon.
The stochastic RSI is beginning to trend upwards, and the downward sloping diagonal trend line, which acts as resistance, could be breached.
The critical mark to overcome is 0.0632. Breaking past this level could lead to higher prices, with altcoins potentially outshining BTC in the short term.
Claim your Bitget sign-up bonuses here (details below).
Chart #4 - Chainlink (LINKUSDT) 8-Hour Chart
Chartist: Sheldon
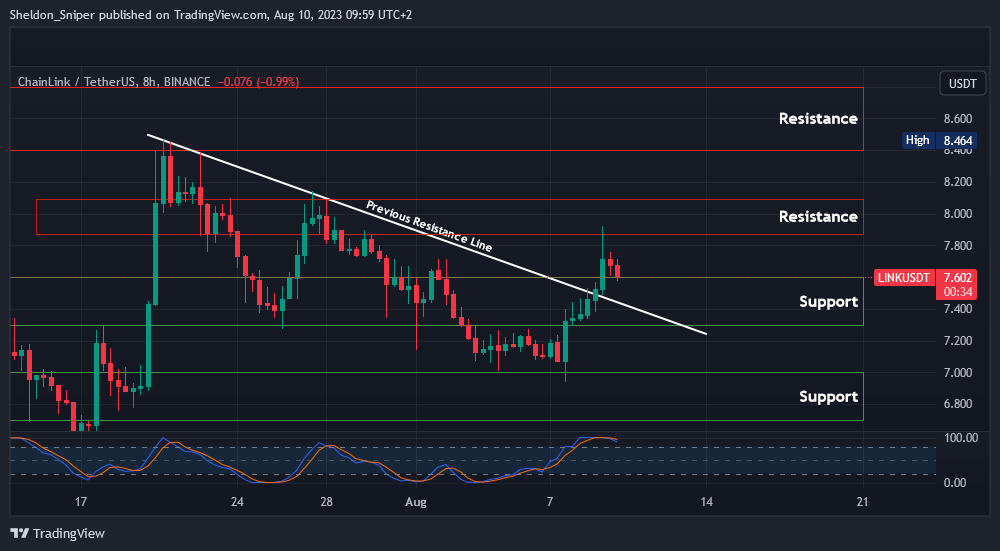
(For the chart screenshot, click here.)
Two days ago, LINK faced resistance in the $7.90 - $8.10 area and has since declined.
The price is now trading at $7.60, entering the $7.30 - $7.60 support zone. Here, the previous descending resistance line from mid-July is also present, now serving as additional support.
I anticipate the price may stabilize in this zone and potentially reverse its trend upwards in the coming days. On the ascent, the subsequent resistance stands at $7.90 - $8.10; surpassing this leads to the $8.40 - $8.70 zone.
Claim your Bitget sign-up bonuses here (details below).
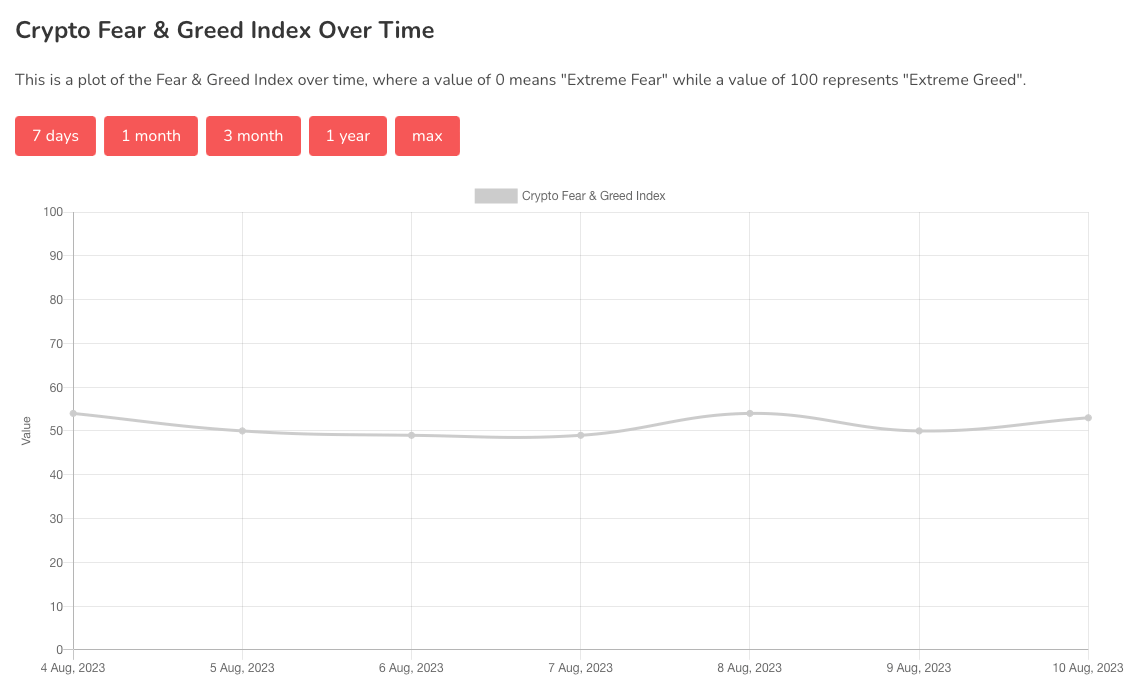
Chart #5 - Fear and Greed Index
The Fear and Greed Index is sitting at 53 today, Neutral.
The highest the index has been over the past seven days is 54, and the lowest is 49.
Banter’s Take
The market is stagnant with exceptionally low volatility, suggesting that the ensuing market shift will be significant when it happens. However, BTC must first regain and maintain crucial points, especially the $29,500 mark.
Stay safe my friends!
Go to our Crypto Banter Discord here where Sheldon and Kyle give updates on the charts and trades from The Daily Candle newsletter!