

📈📉 SEI Pump Incoming? + ENJ Long Trade!
📈📉 SEI Pump Incoming? + ENJ Long Trade!
PLUS: The Critical BTC Level to Watch!
Overview
Chart #1 - Crypto Total Market Cap (TOTAL) Daily
Chart #2 - Sei (SEIUSDT) Daily
Chart #3 - Enjin Coin (ENJUSDT) Daily
Chart #4 - THORChain (RUNEUSDT) Daily
Chart #5 - Fear and Greed Index
Chart #1 - Crypto Total Market Cap (TOTAL) Daily
Chartist: Sheldon
(For the chart screenshot, click here.)
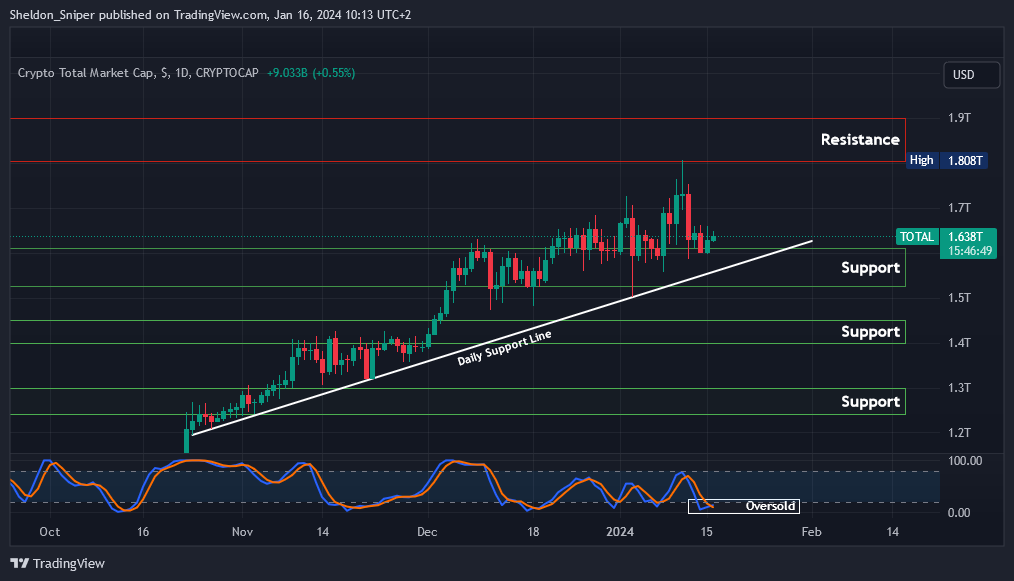
The $1.60 trillion level has been holding as support for the Total Crypto Market Cap for over a month.
With the market oversold on the daily time frame, it could be gearing up for another upward push, testing the small resistance level at $1.70 trillion or even the major resistance area at $1.80 trillion - $1.90 trillion, which was tested a week ago.
In case the $1.60 trillion support is lost, further support can be found at the bottom of the range at $1.525 trillion - $1.55 trillion.
Sign-up and trade on Bybit today.
Exclusive $30,000 deposit rewards and bonuses up for grabs!
Chart #2 - Sei (SEIUSDT) Daily
Chartist: Kyle
(For the chart screenshot, click here.)
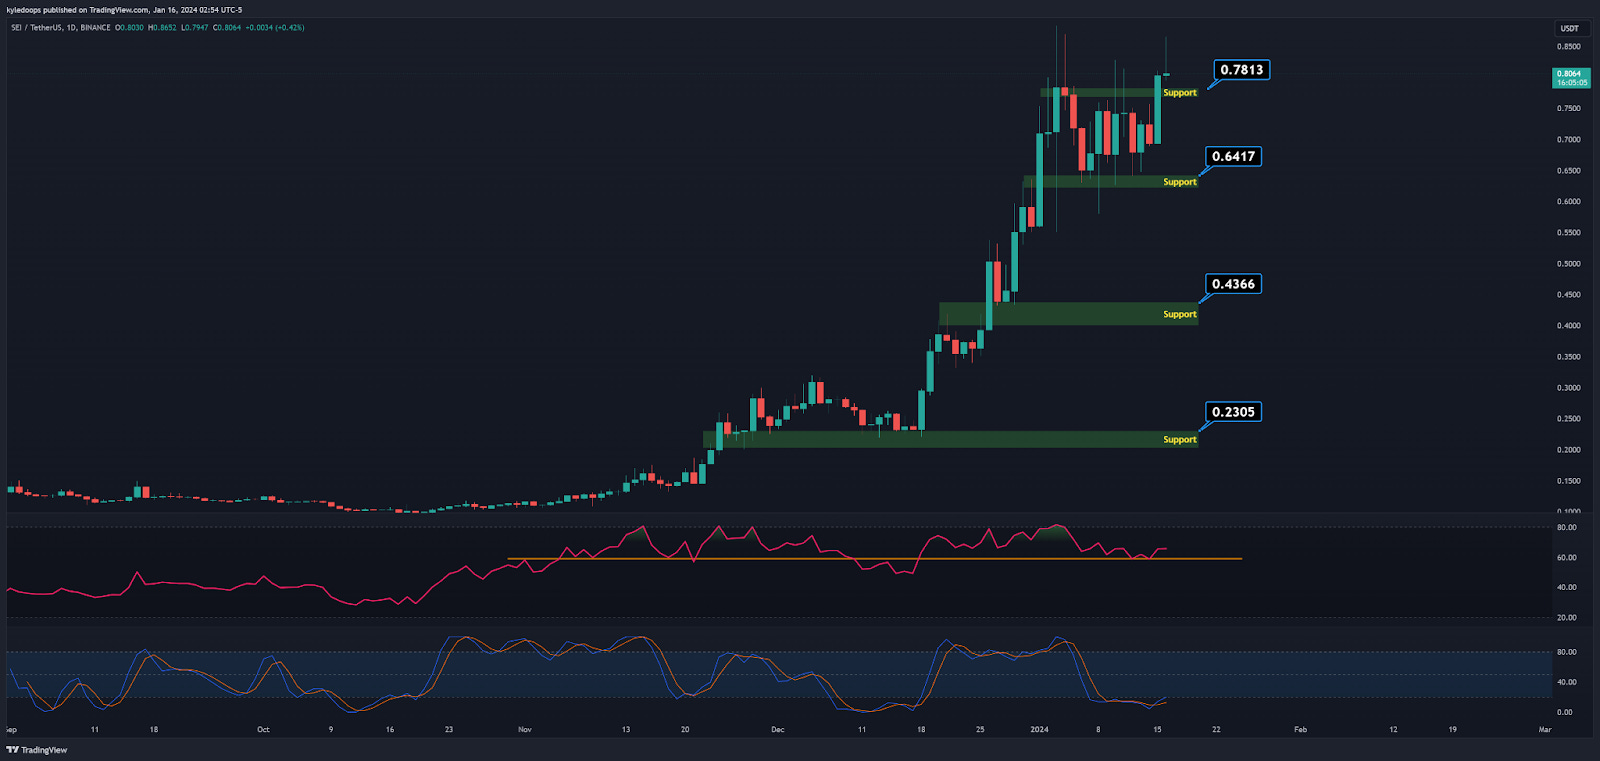
SEI on the daily chart seems to be holding the $0.80 region, and the Stochastic RSI just flashed a cross-up!
As long as Bitcoin consolidates in its range, SEI and other altcoins may have the opportunity to move higher.
Support levels can be found at $0.78 and $0.64. The daily RSI appears to have found local support at 60%, which may indicate an upcoming upward movement.
Claim your Bitget sign-up bonuses here (details below).

Outsmart 99% Of The Market!
Get full access into our Discord And Telegram group, where you'll find all of our premium content!
👉 Trade Signals!
👉 Trade Set-Ups!
👉 Trading Challenges!
👉 Education!
👉 SO MUCH MORE!
Chart #3 - Enjin Coin (ENJUSDT) Daily
Chartist: Kyle
(For the chart screenshot, click here.)
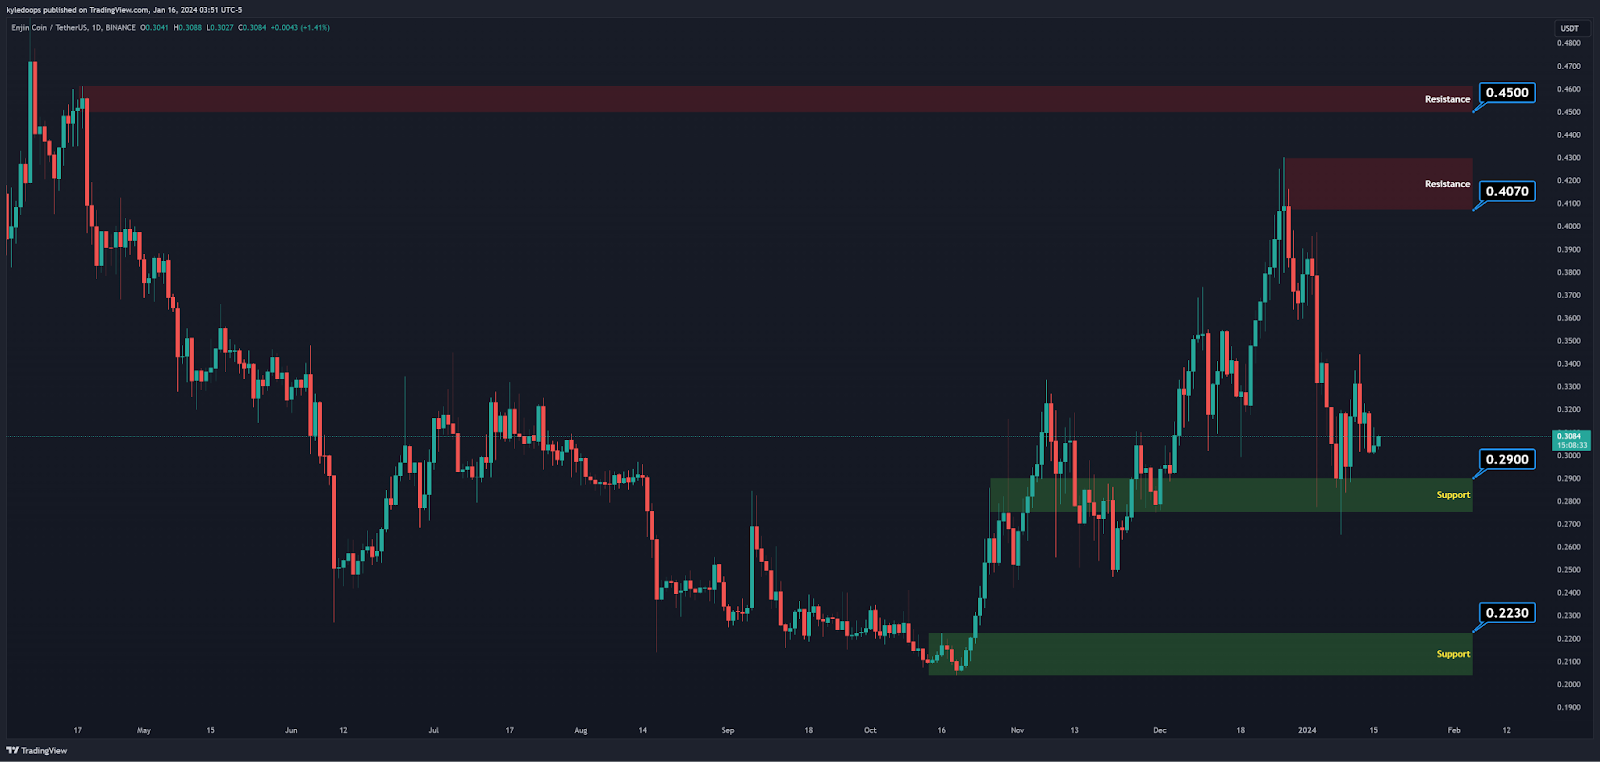
ENJ's market cap stands at $428 million, positioning it as one of the largest gaming platforms, boasting over 18 million gamers, and running on the Ethereum network.
With expectations of Ethereum making a bullish move soon, the entire ecosystem is anticipated to perform well. Key support is observed at $0.29, with a recent deviation and swift recovery, making this area a favorable entry point. The next resistance levels are at $0.41, followed by $0.45.
There is growing hype around virtual reality these days, making this category appealing once again.
Claim your Bitget sign-up bonuses here (details below).
Chart #4 - THORChain (RUNEUSDT) Daily
Chartist: Sheldon
(For the chart screenshot, click here.)
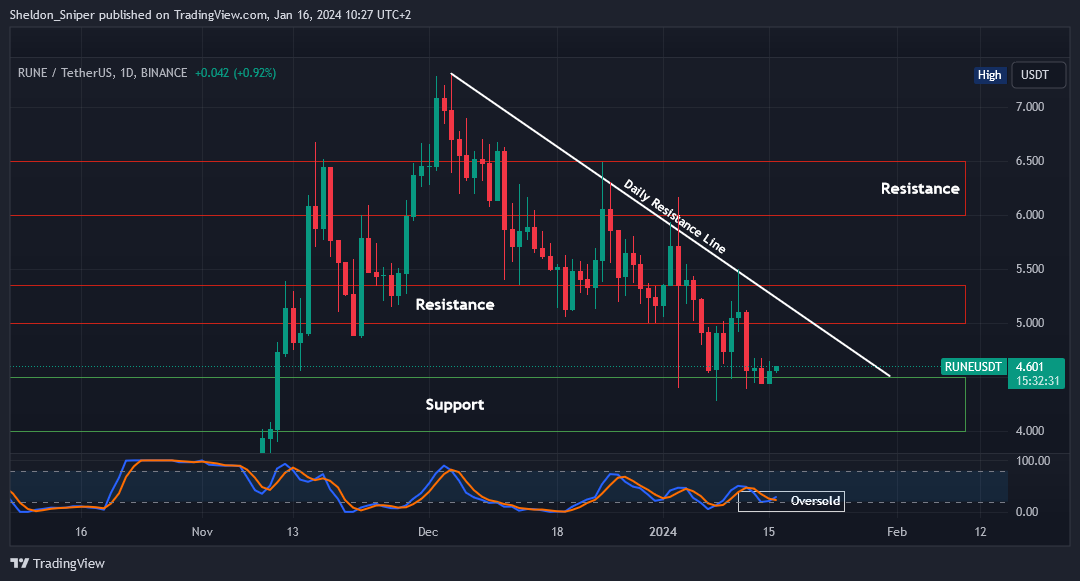
Over the past two weeks, the $4.50 level has served as great support for RUNE's price.
With the price being oversold, it may be preparing to test the next resistance area at $5.00 - $5.40. This range also coincides with the daily descending resistance line from early December, making it a tough resistance zone.
In case the $4.50 support level is breached, the next level of support can be found at around $4.00.
Claim your Bitget sign-up bonuses here (details below).
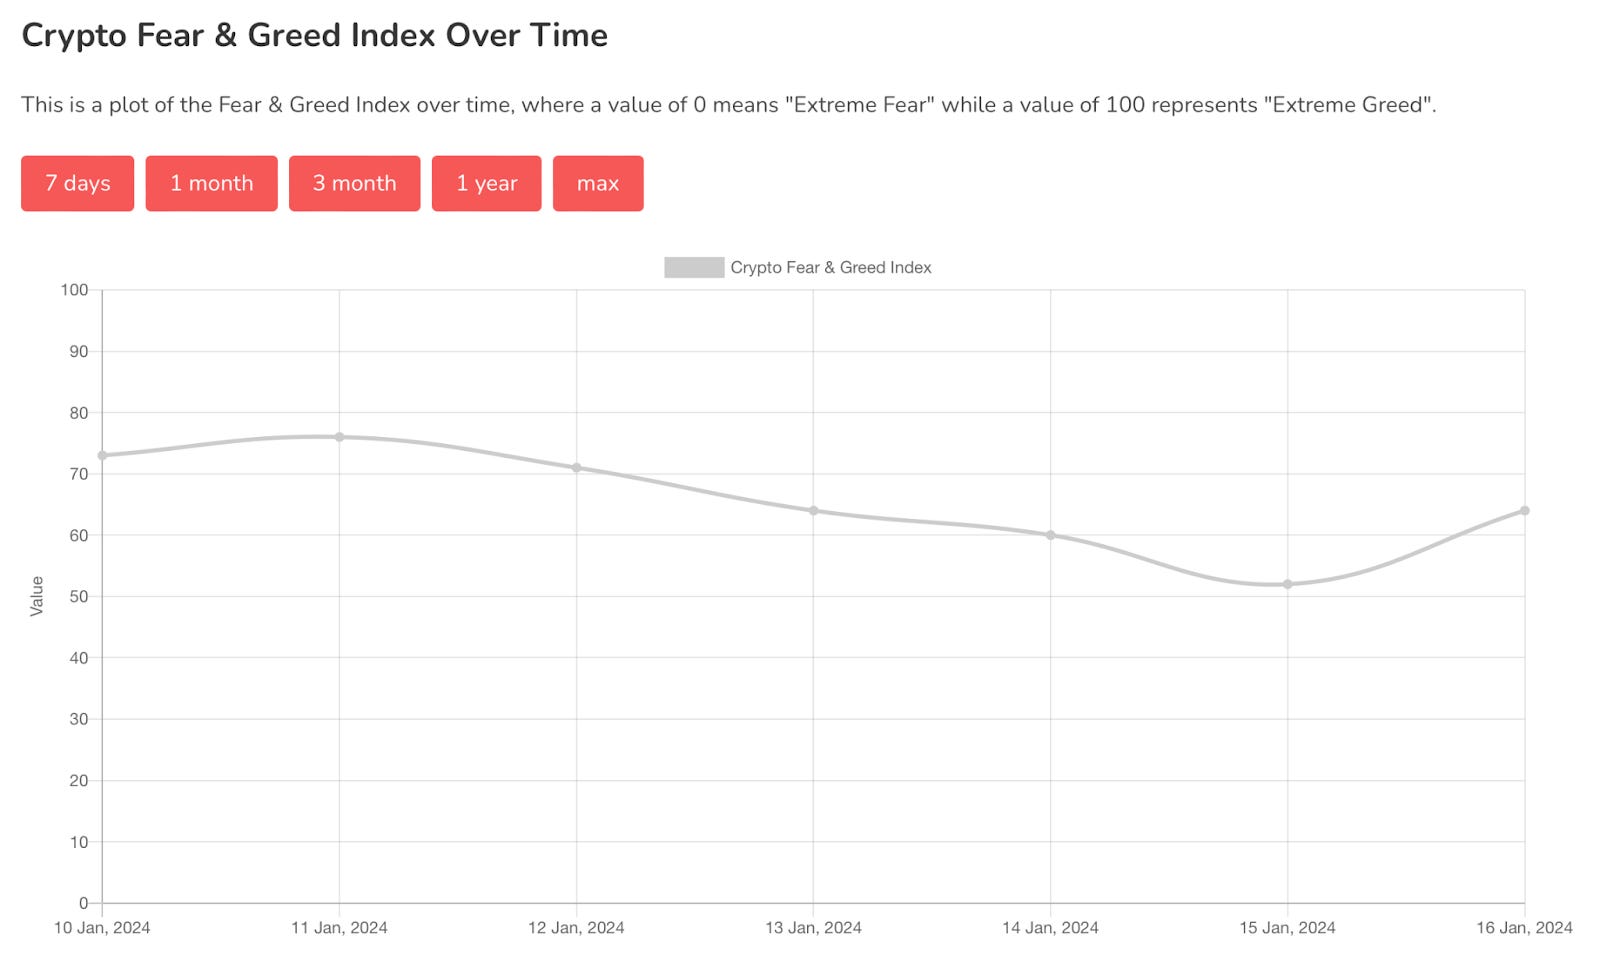
Chart #5 - Fear and Greed Index
The Fear and Greed Index is sitting at 64 today, indicating Greed.
The highest the index has been over the past seven days is 76, and the lowest is 52.
Banter’s Take
Market movement was limited yesterday, and as long as Bitcoin continues to consolidate or gradually decline, it provides a significant advantage to altcoins. The critical level to watch is $40,200; breaking this level could shift the entire market dynamic.
Stay safe my friends!
Go to our Crypto Banter Discord here where Sheldon and Kyle give updates on the charts and trades from The Daily Candle newsletter!