

📈📉 Sidelined cash waiting for a pullback! CRV could increase by 50%!
📈📉 Sidelined cash waiting for a pullback! CRV could increase by 50%!

Chart #1 - Bitcoin (BTCUSDT) 1-Day Chart
Chartist: Sheldon

(For the chart screenshot, click here.)
On Friday, bitcoin started the day at around $21,000 and rallied to just under $23,000 (+9%). And on Saturday, it moved even higher, to $23,400, before retracing to the current $22,700 price. Overall, BTC has made a massive 45% move up over the past three weeks, with no significant correction taking place. So, there are many traders waiting on the sidelines for such a correction so they can enter the market.
BTC is currently trading in an area of resistance and overbought on the higher time frames. So the question is whether we will see a pullback that allows new money to enter crypto, or whether the market continues higher. If the price retraces, the next important support levels are at $21,300, followed by $19,600 (daily 200 moving average), and $18,187. If BTC consolidates in this area and moves higher, breaking through $23,000, the next crucial area of resistance is roughly $24,700.
It is anybody’s guess what BTC does next, so we must be prepared for both scenarios.
Check our Crypto Banter Discord here for updates!
Follow me on Twitter for urgent updates on my trading progress!
Claim your Bitget sign-up bonuses here (details below).
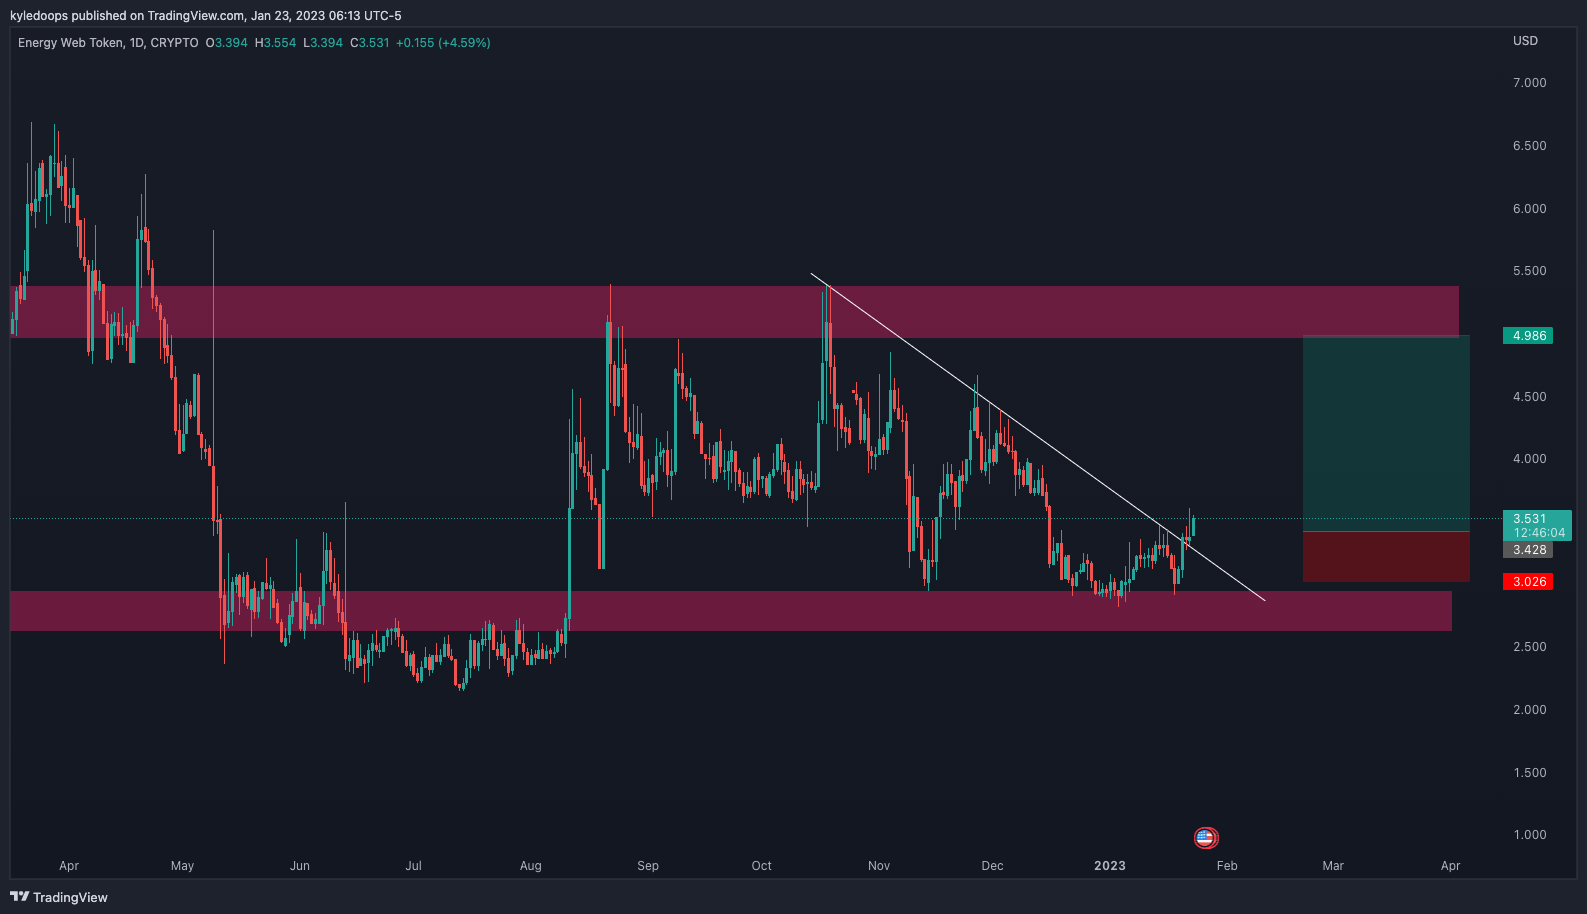
Chart #2 - Energy Web (EWTUSD) 1-Day Chart
Chartist: Kyle
(For the chart screenshot, click here.)
EWT is presenting a swing trade opportunity.
Bouncing off of the range-low, the first target would be $3.95 at the mid-range. After that, a breakthrough would potentially see the price move up to $4.94.
That represents a potential 45% move for a spot position trade.
Check our Crypto Banter Discord here for updates!
Make sure to follow me on Twitter, where I will post updates on my trades as they unfold!
Claim your Bitget sign-up bonuses here (details below).
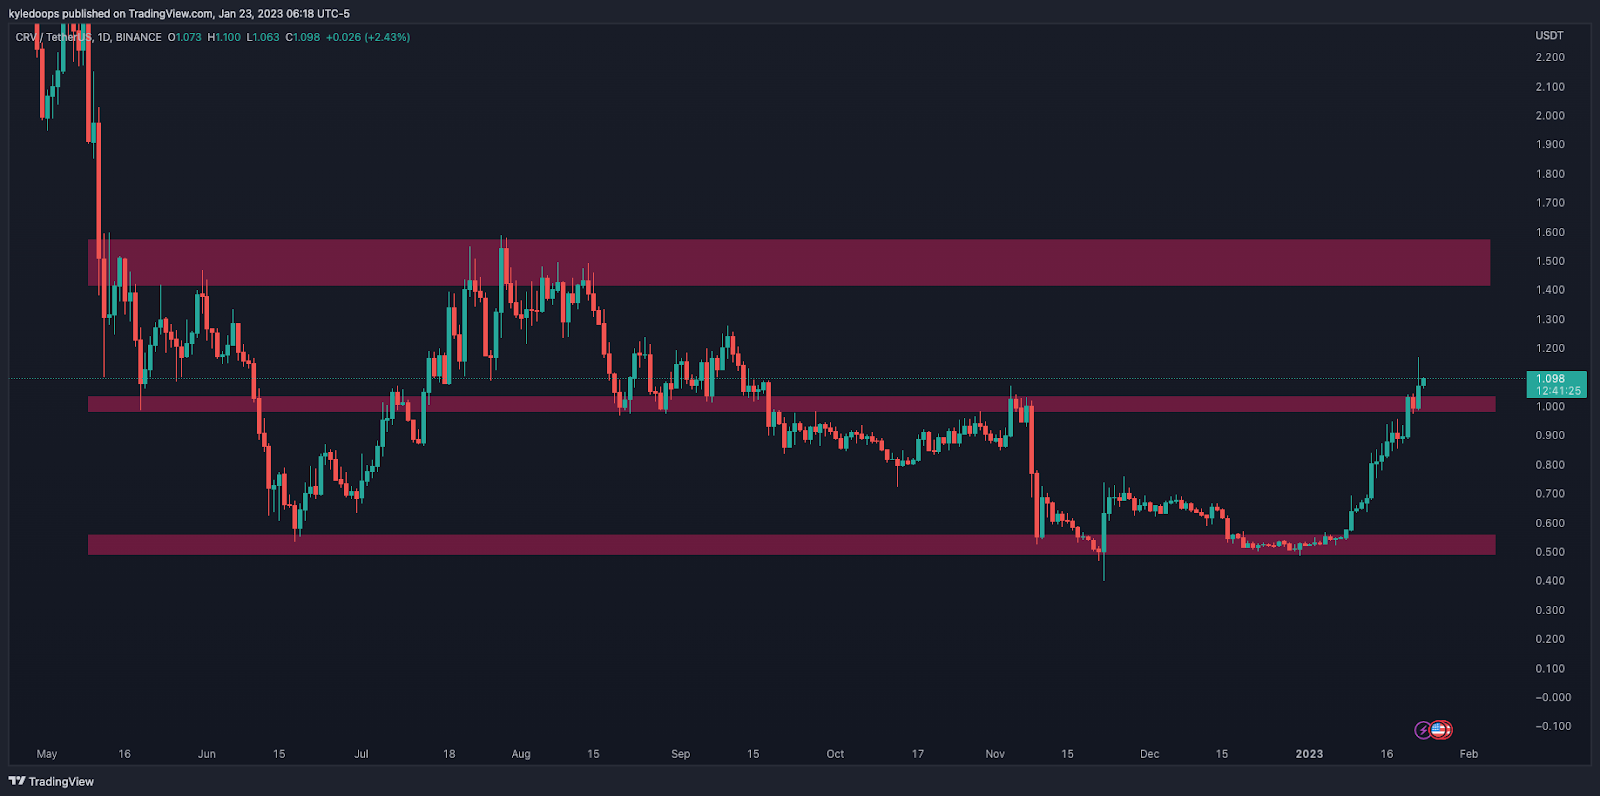
Chart #3 - Curve DAO (CRVUSDT) 1-Day Chart
Chartist: Kyle
(For the chart screenshot, click here.)
CRV has broken above the $1.00 mark (mid-range).
So now, anything above $1.00 is an opportunity to long to the range-high, which comes in at $1.50.
If the price breaks below the mid-range, I'll treat it as a possible deviation, and we will re-evaluate for opportunities to catch the dip lower.
Check our Crypto Banter Discord here for updates!
Make sure to follow me on Twitter, where I will post updates on my trades as they unfold!
Claim your Bitget sign-up bonuses here (details below).
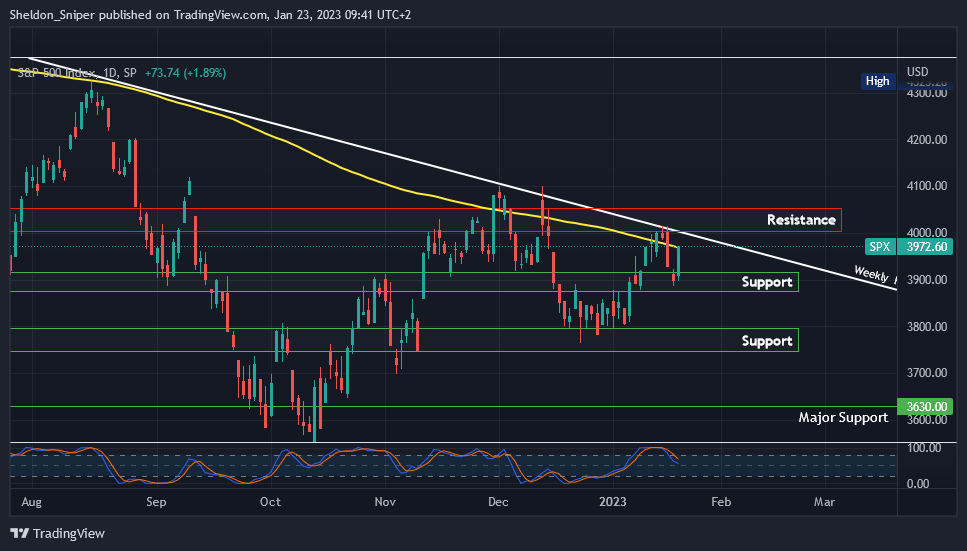
Chart #4 - S&P 500 1-Day Chart
Chartist: Sheldon
(For the chart screenshot, click here.)
Over the past three weeks, the SPX has gone from 3,800 to 4,000, retraced from there to 3,900, and moved up to 3,972 again.
The price is now at resistance, at the daily 200 moving average (yellow line), and approaching 4,000, as well as the weekly descending resistance line (white line) from January 2022.
If these major resistance levels break, the SPX will rally to 4,100 (resistance) - possibly even 4,300. If it retraces, the next support is at 3,900, followed by the 3,750 - 3,800 area. Either way, the direction the US stock markets take over the next few days will lead the way for crypto.
Check our Crypto Banter Discord here for updates!
Follow me on Twitter to get all the updates on my personal trading progress!
Claim your Bitget sign-up bonuses here (details below).
Chart #5 - Bitcoin Fear and Greed Index
The Bitcoin Fear and Greed Index is sitting at 50 today, Neutral.
The highest the index has been over the past seven days is 53, and the lowest is 45.

Overall Market Sentiment (Banter’s Take)
This week is crucial for both bitcoin and the stock market. Economic data and earnings reports will play a significant role in determining the direction of the S&P 500, which will influence crypto.
Since the S&P 500 has not yet broken out and is up against resistance - still in a downtrend - it will be decision time.
That will either confirm bitcoin’s breakout as real or confirm a trap.
Stay safe my friends!
Thank you Sheldon!
Thank you Sheldon!