

📈📉 SOL and RLB Trade Setups!
📈📉 SOL and RLB Trade Setups!
PLUS: BTC Looks Primed to Continue Higher!
Overview
Chart #1 - Bitcoin Dominance (BTC.D) Daily
Chart #2 - Rollbit (RLBUSD) Daily
Chart #3 - Solana (SOLUSDT) Daily
Chart #4 - Crypto Total Market Cap (TOTAL) Daily
Chart #5 - Fear and Greed Index
Chart #1 - Bitcoin Dominance (BTC.D) Daily
Chartist: Sheldon

(For the chart screenshot, click here.)
Bitcoin Dominance has reached the 53% level of resistance and is overbought.
BTC.D could now either:
1) Continue to the upside to possibly test the next resistance at 54%, which would be bearish for the alts, or
2) Reject in this area and trend to to 52.50%
Sign-up and trade on Bybit today.
Exclusive $30,000 deposit rewards and bonuses up for grabs!
Chart #2 - Rollbit (RLBUSD) Daily
Chartist: Kyle

(For the chart screenshot, click here.)
Rollbit has bounced from key support at the bottom of the ascending channel.
This should be a good enough trade up to the mid-range at $0.20.
Rollbit has constantly been burning coins too, which is creating a deflationary effect.
Claim your Bitget sign-up bonuses here (details below).

Outsmart 99% Of The Market!
Get full access into our Discord And Telegram group, where you'll find all of our premium content!
👉 Trade Signals!
👉 Trade Set-Ups!
👉 Trading Challenges!
👉 Education!
👉 SO MUCH MORE!
Chart #3 - Solana (SOLUSDT) Daily
Chartist: Kyle
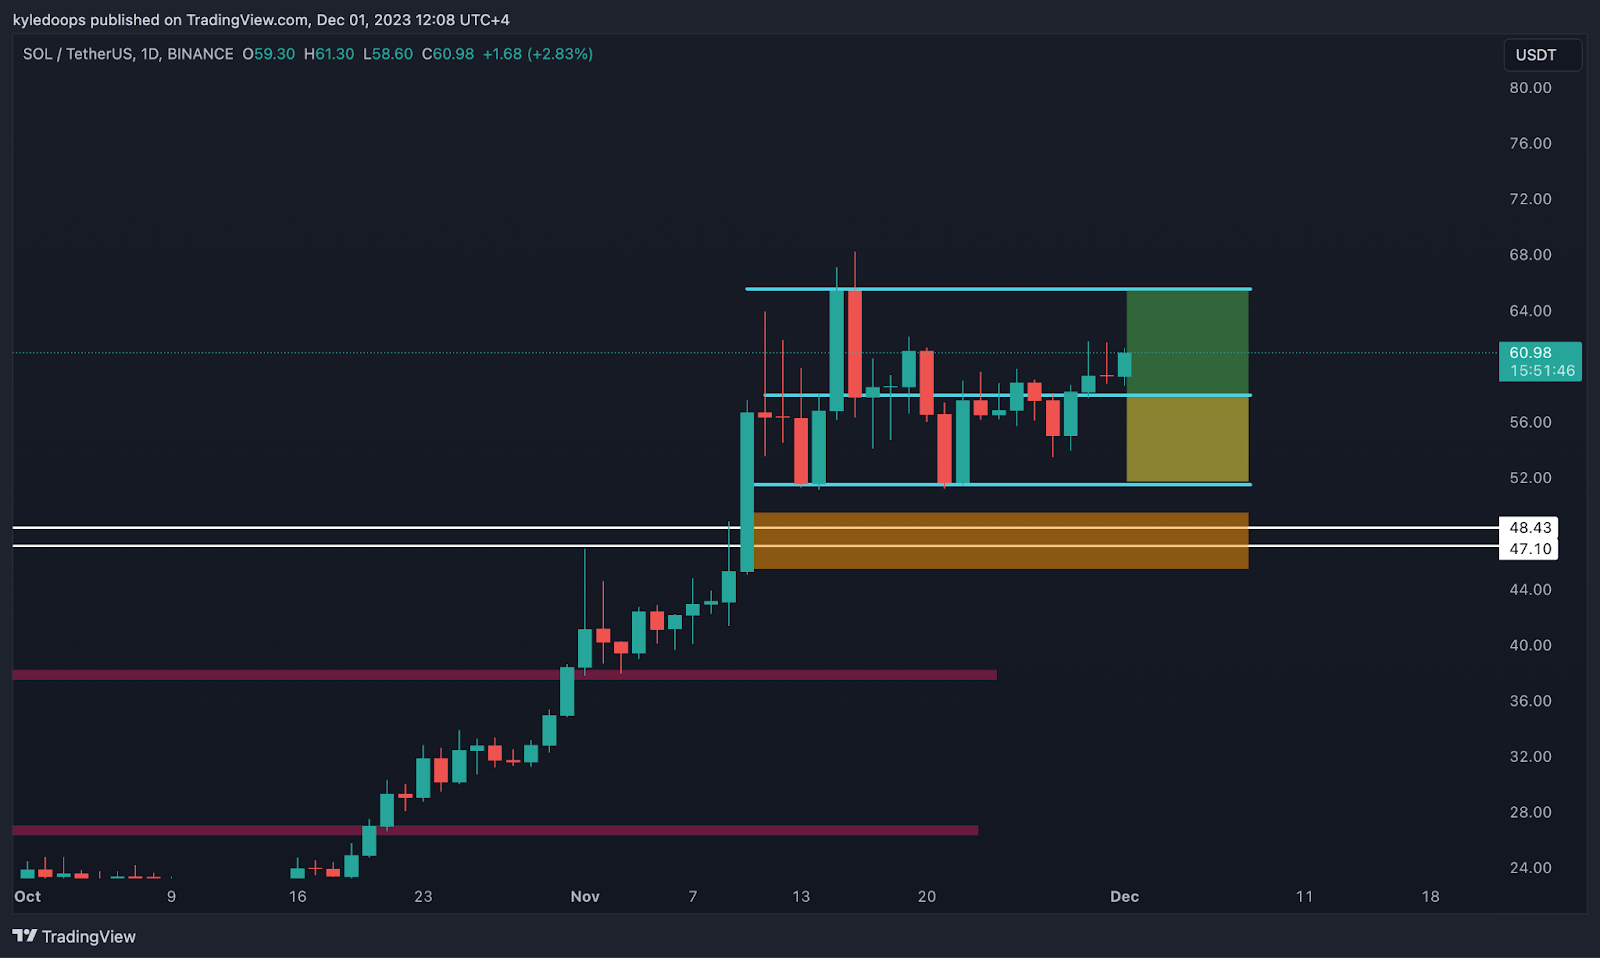
(For the chart screenshot, click here.)
SOL is range-bound between $51 and $65.
The green zone denotes the premium zone and the yellow zone the discount zone.
Once the price comes into the yellow zone, that is an opportunity to build longs.
The $48 level is a fair value gap. If that level is hit and the price immediately moves back into the yellow zone, then that would be a bear trap and confirm the price is likely heading higher.
Claim your Bitget sign-up bonuses here (details below).
Chart #4 - Crypto Total Market Cap (TOTAL) Daily
Chartist: Sheldon

(For the chart screenshot, click here.)
The TOTAL is testing $1.415T which has been acting as resistance over the last three weeks.
If it breaks this level over the weekend, the next resistance is at $1.45T, followed by $1.5T.
Claim your Bitget sign-up bonuses here (details below).
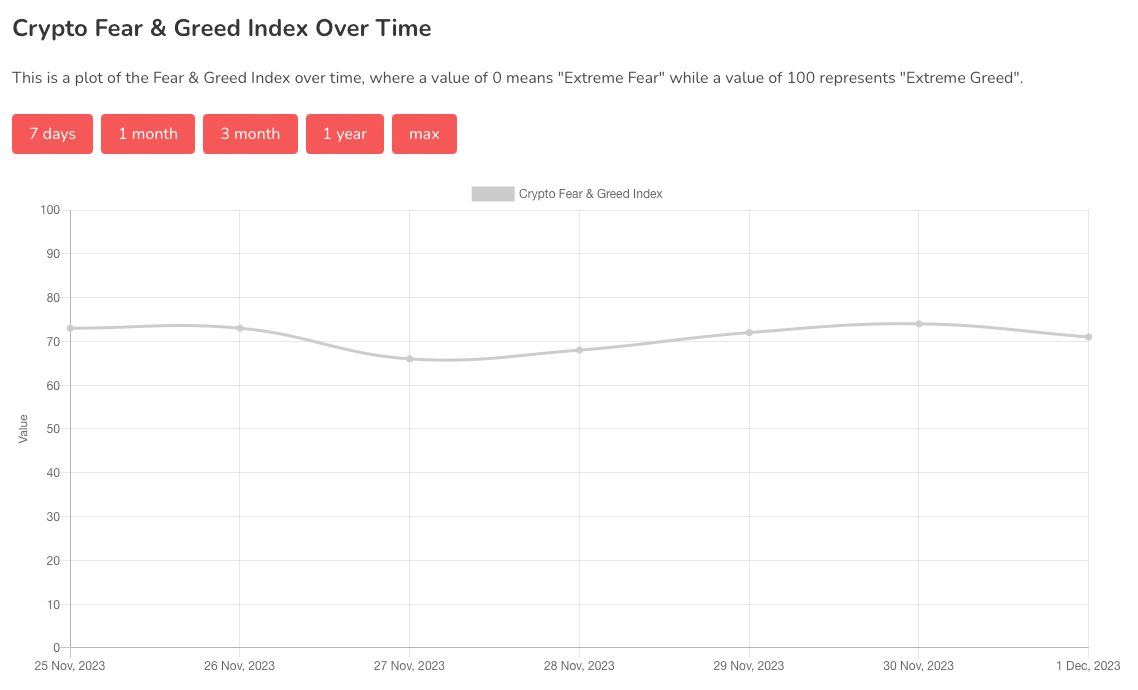
Chart #5 - Fear and Greed Index
The Fear and Greed Index is sitting at 71 today, indicatingGreed.
The highest the index has been over the past seven days is 74, and the lowest is 66.
Banter’s Take
Bitcoin had an extremely strong monthly close and looks primed to continue higher. ETH needs to close above $2,100, and a real breakout should be in place soon.
Stay safe my friends!
Go to our Crypto Banter Discord here where Sheldon and Kyle give updates on the charts and trades from The Daily Candle newsletter!