

📈📉 SOL Long Level! + Explosive BTC Move Coming?
📈📉 SOL Long Level! + Explosive BTC Move Coming?

Overview
Chart #1 - Solana (SOLUSDT) Daily Chart
Chart #2 - Bitcoin (BTCUSD) 3-Day Chart
Chart #3 - S&P 500 (ES1!) Daily Chart
Chart #4 - Polkadot (DOTUSDT) Daily Chart
Chart #5 - Fear and Greed Index

Chart #1 - Solana (SOLUSDT) Daily Chart
Chartist: Sheldon
(For the chart screenshot, click here.)
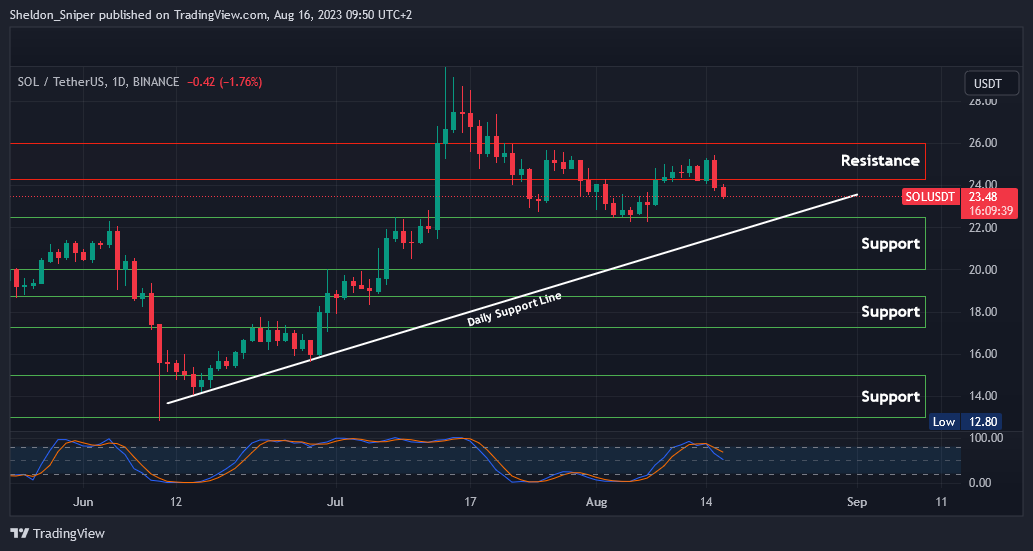
Yesterday, SOL was rejected at around $25 and has since begun to retrace alongside the rest of the market.
The price is currently trading at $23.50, and there's a chance it heads down to $22.00 - $23.00, near the ascending support line from mid-June. Given the significant support in this zone, it could present an opportunity for a long trade up to around $24.00.
If both the $22.00 mark and the daily support line fail to hold, SOL could print at $20.00.
Overall, SOL has stood out as one of the most resilient coins in recent weeks. Once it finds its support, we’ll see a significant bounce to the upside!
Sign-up and trade on Bybit today.
Exclusive $30,000 deposit rewards and bonuses up for grabs!
Chart #2 - Bitcoin (BTCUSD) 3-Day Chart
Chartist: Kyle
(For the chart screenshot, click here.)
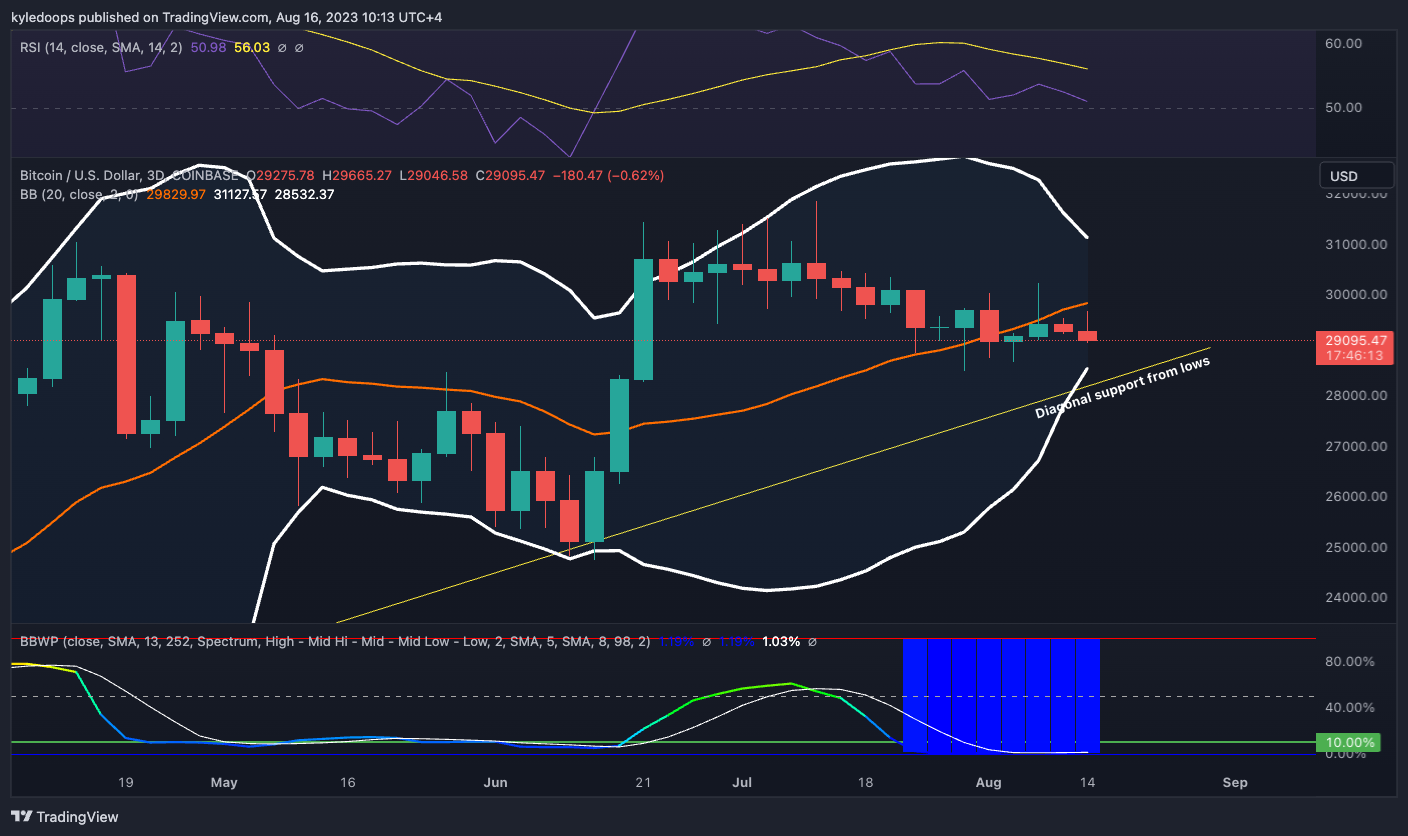
Bitcoin's Bollinger bands continue to contract in on one another, suggesting that the price is still coiling up like a spring and preparing for the next major move.
And, the BBWP in the lower pane has printed massive blue ribbons, which align with the fact that major volatility is right around the corner. There is also strong support at $28,000, which is why it's so important for bulls to defend this level.
The next move will have enough momentum to either break the major support if the expansion is to the downside, or break the major resistance at $32,000 if the expansion is to the upside.
𝗣𝗿𝗶𝗺𝗲 𝗫𝗕𝗧
Sign up for a new Trading Account on Prime XBT!
Receive a deposit bonus of up to $7,000 with promo code: KyleDoops
Chart #3 - S&P 500 (ES1!) Daily Chart
Chartist: Kyle
(For the chart screenshot, click here.)
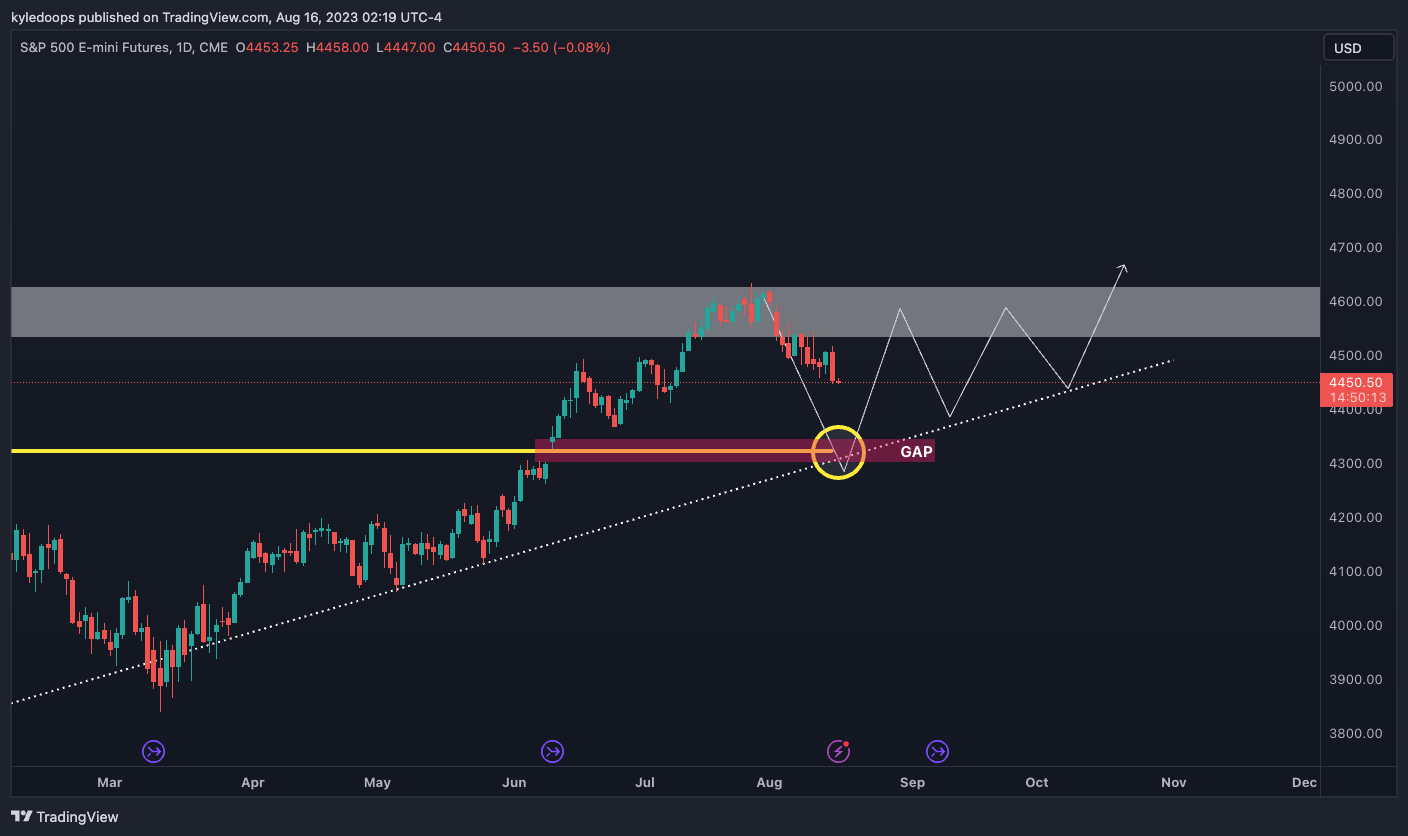
The ES1! daily chart is still in its corrective phase.
The main area of interest would be a trade down to the trend line support, which also coincides with the range high from the breakout, as well as the GAP where the price gapped up.
I would anticipate a major bounce there and expect the price to consolidate again before breaking out later this year.
That key level is at 4,326!
Claim your Bitget sign-up bonuses here (details below).
Chart #4 - Polkadot (DOTUSDT) Daily Chart
Chartist: Sheldon
(For the chart screenshot, click here.)
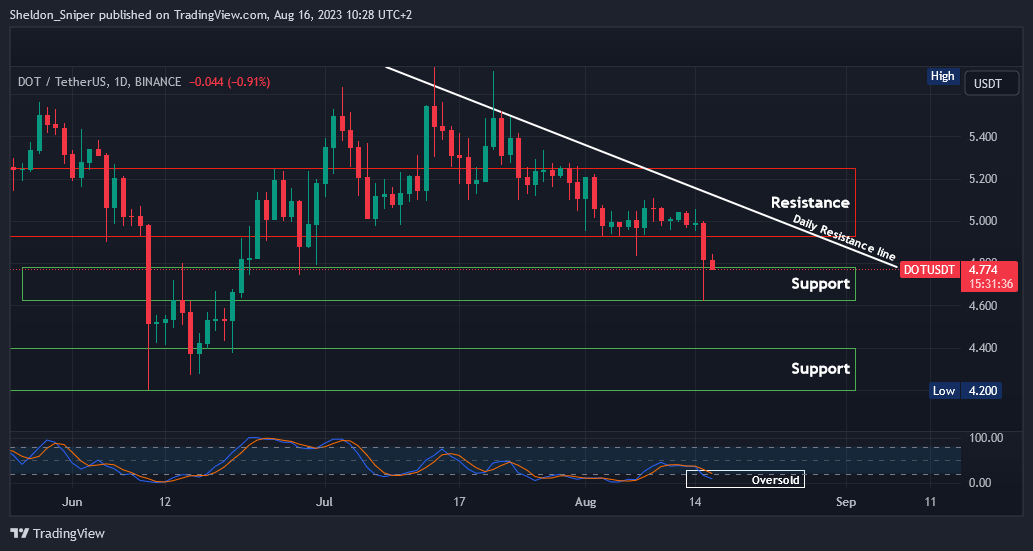
DOT has dropped below its $4.95 support level and, following the trend of the broader market, has found support around $4.60. The price currently hovers at approximately $4.80, is oversold on the daily timeframes, and finds itself within the $4.60 - $4.75 support zone.
If the price stabilizes in this region, there's potential for a move upward to retest the $4.95 level.
Additionally, the daily descending resistance line from mid-July, can be found near this level. Should DOT breach the $4.60 support, the next support zone lies between $4.20 and $4.40.
Claim your Bitget sign-up bonuses here (details below).
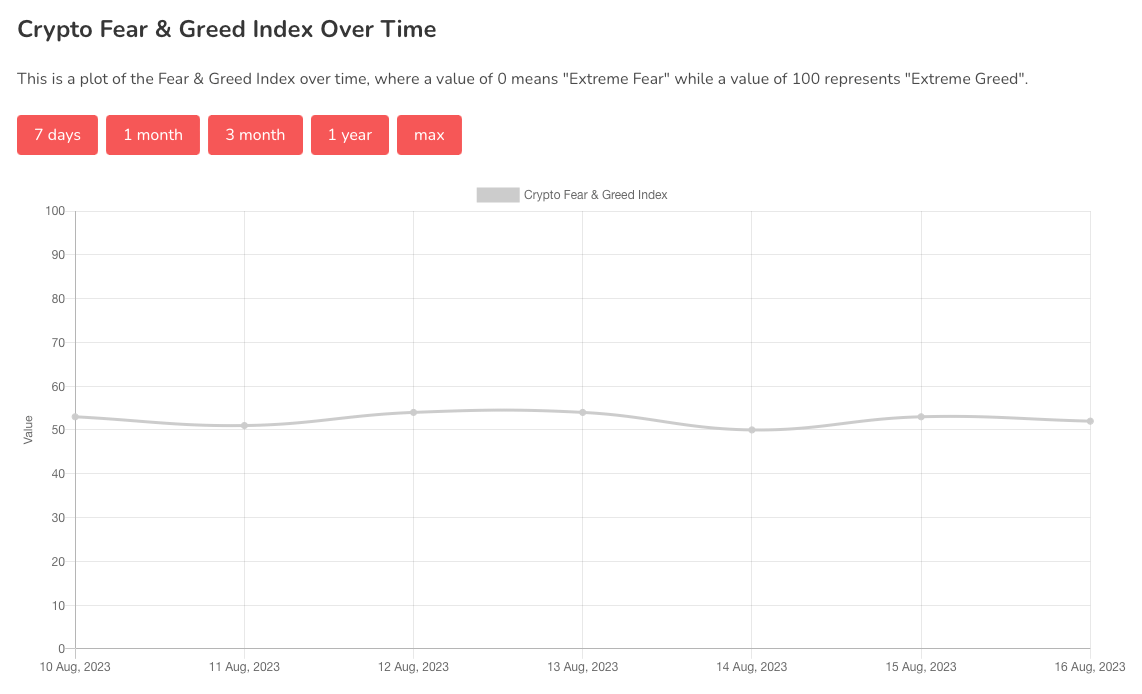
Chart #5 - Fear and Greed Index
The Fear and Greed Index is sitting at 52 today, Neutral.
The highest the index has been over the past seven days is 54, and the lowest is 50.
Banter’s Take
The stock market will likely continue its decline, adding additional pressure to Bitcoin. However, these are shorter timeframe corrections within a higher timeframe uptrend. So, it's a "buy the dip" opportunity, if anything.
Stay safe my friends!
Go to our Crypto Banter Discord here where Sheldon and Kyle give updates on the charts and trades from The Daily Candle newsletter!