

📈📉 SOL Looking Bullish! KASPA Continues Pumping!
📈📉 SOL Looking Bullish! KASPA Continues Pumping!

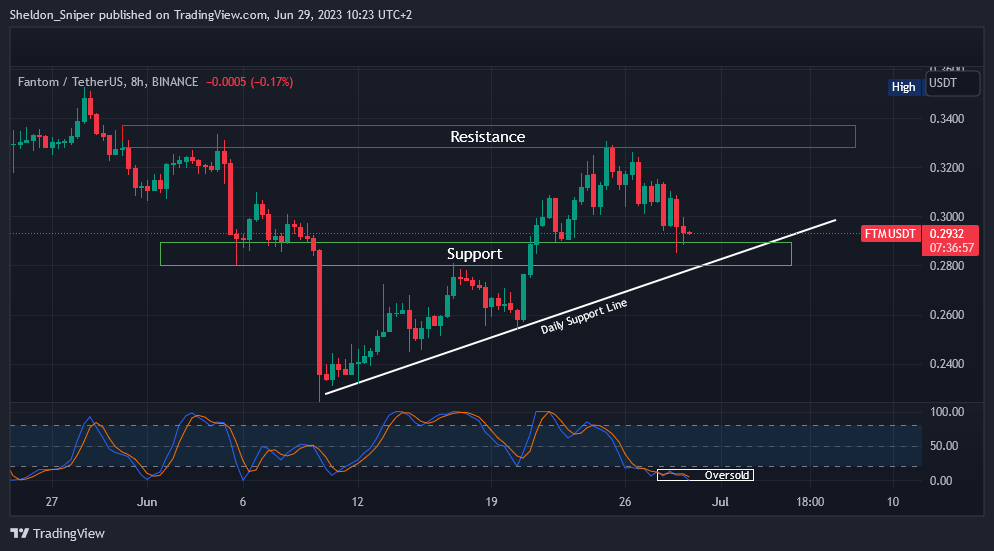
Chart #1 - Fantom (FTMUSDT) 8-Hour Chart
Chartist: Sheldon
(For the chart screenshot, click here.)
Last night, the price of FTM dropped to the $0.28 - $0.2950 major support area. Notably, the daily ascending support trend line from the beginning of June is in the same region, providing additional support.
I now anticipate price stabilization and consolidation within this zone, potentially setting FTM up for its next upward move.
On medium-term timeframes, the price is oversold, so if FTM manages to reverse its trend back upwards it will head to $0.33 - $0.34. This zone was tested twice in June, with rejection occurring both times.
Sign-up and trade on Bybit today.
Exclusive $30,000 deposit rewards and bonuses up for grabs!
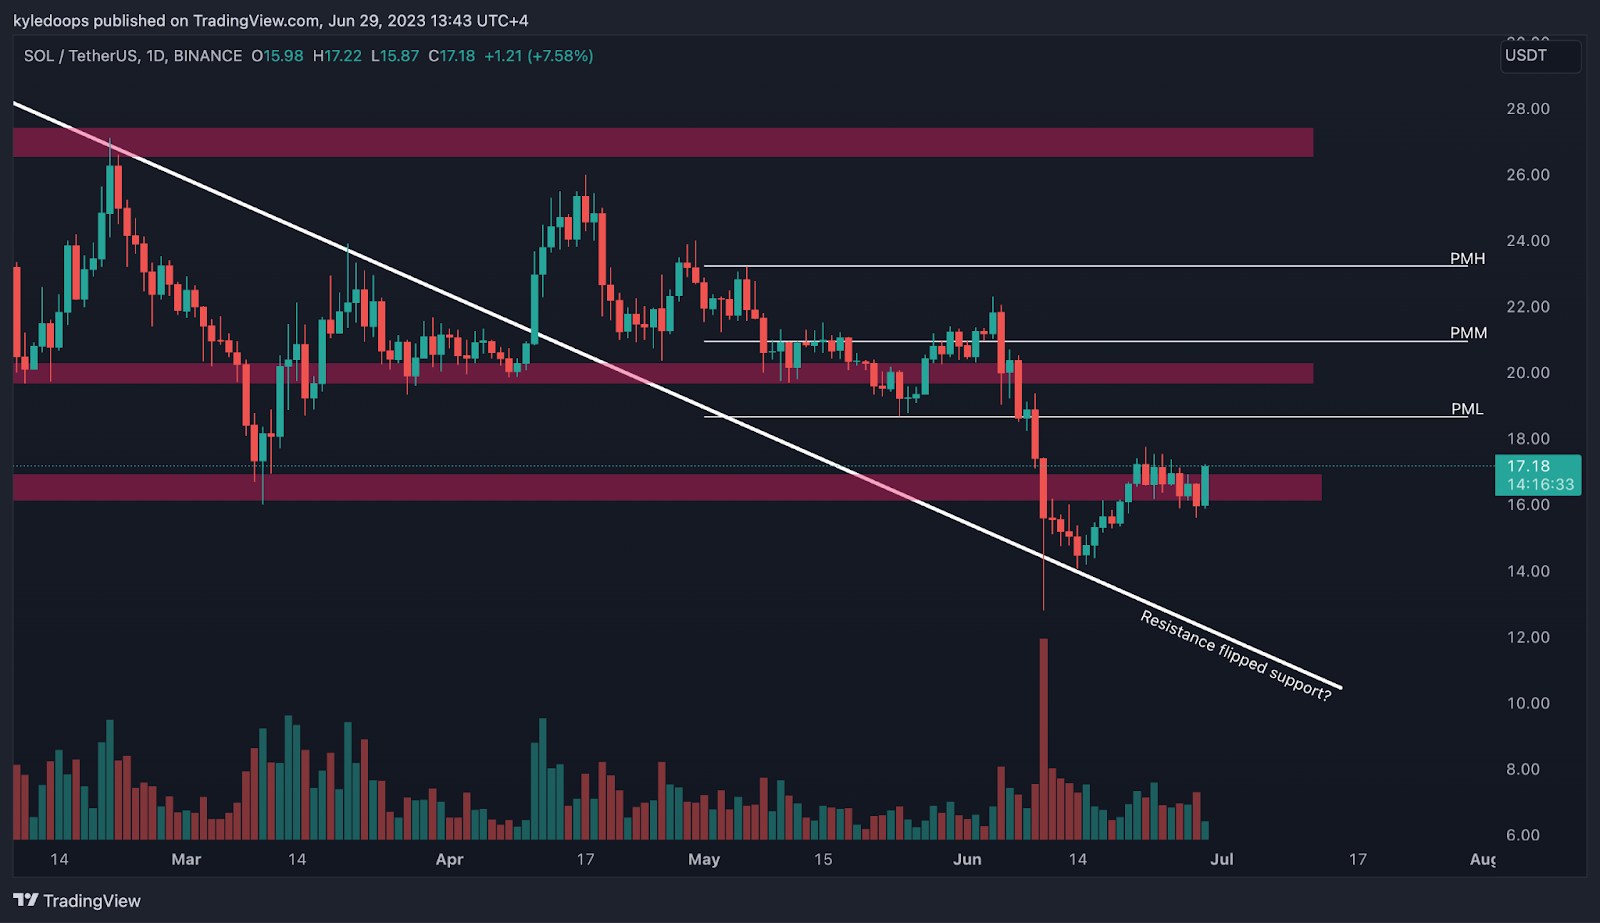
Chart #2 - Solana (SOLUSDT) 1-Day Chart
Chartist: Kyle
(For the chart screenshot, click here.)
SOL is currently making a significant move!
If the price closes at its current level or higher, it will confirm the next higher low on the daily chart, supporting the bulls' case for defending the $17 mark as the range's lower boundary.
That means it would be a deviation into the broader range, potentially allowing SOL to rise to $20 in the upcoming weeks.
𝗣𝗿𝗶𝗺𝗲 𝗫𝗕𝗧
Sign up for a new Trading Account on Prime XBT!
Receive a deposit bonus of up to $7,000 with promo code: KyleDoops

Sign up for a new Trading Account on Prime XBT!
Receive a deposit bonus of up to $7,000 with promo code: SheldonSniper
Chart #3 - Kaspa (KASUSDT) 4-Hour Chart
Chartist: Kyle

(For the chart screenshot, click here.)
KASPA is one of the few coins in an uptrend against Bitcoin.
It's consistently holding this diagonal trend line superbly, appearing to confirm another higher low, indicating trend continuation.
I would set the target at the recent highs of $0.28 and, subsequently, the previous month's highs at $0.33.
Claim your Bitget sign-up bonuses here (details below).
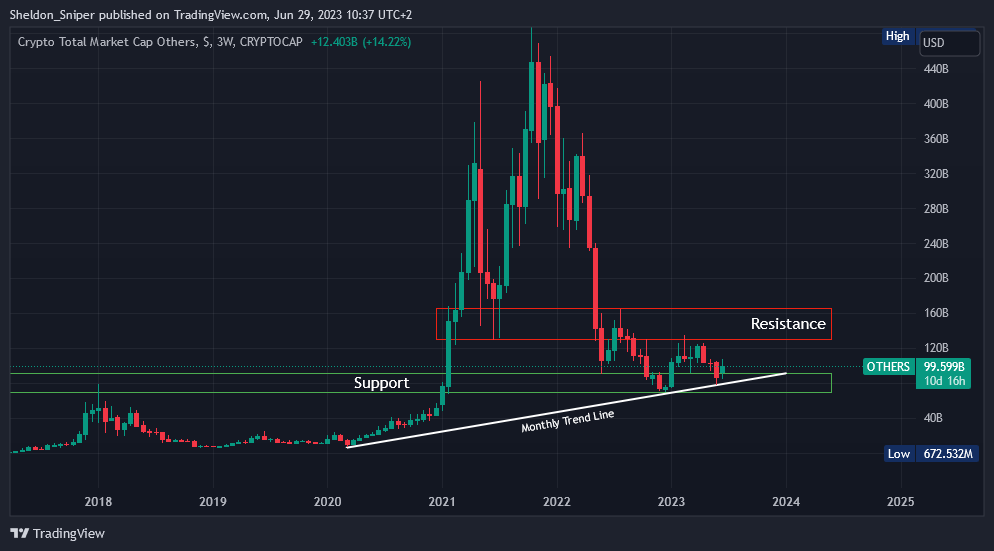
Chart #4 - Others Market Cap 3-Week Chart
Chartist: Sheldon
(For the chart screenshot, click here.)
The Total Others chart represents the total market cap of the crypto market, excluding BTC and the major altcoins, hence representing a number of alts from the medium to micro-cap category.
It fell to $80B - $95B last December. Interestingly, this same area was a resistance point during the 2017 peak, but is now support. Over the past six months, it has risen, only to find resistance and subsequent rejection at the $125B mark. It then retraced back down to the $95B support level, where the monthly ascending support line is also located.
If it holds here, it should pump over the next few weeks.
Claim your Bitget sign-up bonuses here (details below).
Chart #5 - Bitcoin Fear and Greed Index
The Bitcoin Fear and Greed Index is sitting at 54 today, Neutral.
The highest the index has been over the past seven days is 65, and the lowest is 54.

Banter’s Take
The longer the Bitcoin bulls keep price going sideways, the higher the chances are of a massive breakout. Stay focused!
Stay safe my friends!
Go to our Crypto Banter Discord here where Sheldon and Kyle give updates on the charts and trades from The Daily Candle newsletter!