

SOL Scalp Long + End of ETH consolidation?
SOL Scalp Long + End of ETH consolidation?

Overview
Chart #1 - Solana (SOL/USDT) 4-Hour Chart
Chart #2 - Ethereum (ETH/USD) Daily Chart
Chart #3 - Bitcoin (BTC/USD) Daily Chart
Chart #4 - Crypto Total Market Cap 12-Hour Chart
Chart #5 - Fear and Greed Index

Chart #1 - Solana (SOL/USDT) 4-Hour Chart
Chartist: Sheldon

The price of Solana is currently finding support at $22.50.
As price is oversold on the 4HR, there is a possibility of a “scalp” long trade to the next resistance, which is the Descending resistance line that is coming from the middle of July, at around $23.60 - $24.00.
The Market is very volatile at the moment, so I am putting my tight SL just below the current $22.50 support level. If the $22.50 support level is lost, the next level of support is at $21.00, and below that is the bottom of the range area of support at around $20.00.
Sign-up and trade on Bybit today.
Exclusive $30,000 deposit rewards and bonuses up for grabs!
Chart #2 - Ethereum (ETH/USD) Daily Chart
Chartist: Kyle

Ethereum consolidation is also nearing its end, its coming into both the 200 ma, 200 ema support and the diagonal trend line which comes in at $1786.
This is a strong buy zone and has a lot of added confluence.
𝗣𝗿𝗶𝗺𝗲 𝗫𝗕𝗧
Sign up for a new Trading Account on Prime XBT!
Receive a deposit bonus of up to $7,000 with promo code: KyleDoops

Sign up for a new Trading Account on Prime XBT!
Receive a deposit bonus of up to $7,000 with promo code: SheldonSniper
Chart #3 - Bitcoin (BTC/USD) Daily Chart
Chartist: Kyle

Bitcoin is still consolidating into a key-level, the main area of interest comes between $27,000 and $28,000 which is the up sloping trend line and the 200 MA and EMA.
Timing wise, this consolidation likely comes to an end by the 15th of August.
Claim your Bitget sign-up bonuses here (details below).
Chart #4 - Crypto Total Market Cap 12-Hour Chart
Chartist: Sheldon

The Total Market Cap is currently on the $1.125T level of support and the market is oversold on higher time frames.
The Market is currently very volatile, but I still feel there is a possibility of small move higher to test the next resistance, which will be the descending 4HR Resistance Line, around $1.15T - $1.16T.
If this support level is lost, then the next support level is at $1.1T, and to the upside, if the Descending Resistance line is broken, the next major resistance is at $1.18T - $1.2T.
Claim your Bitget sign-up bonuses here (details below).
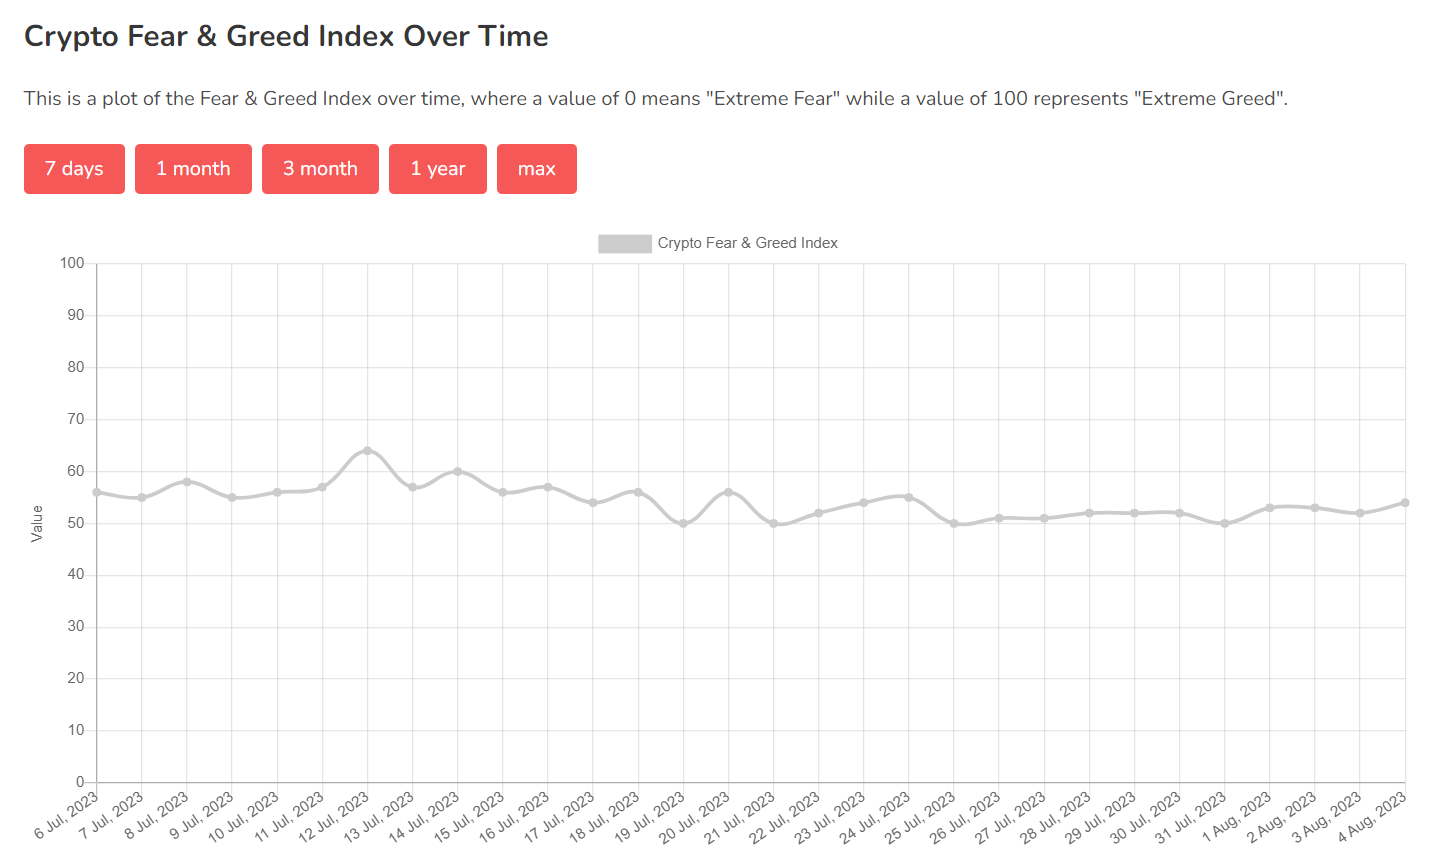
Chart #5 - Fear and Greed Index
The Fear and Greed Index is sitting at 54 today, Neutral.
The highest the index has been over the past seven days is 54, and the lowest is 50.
Banter’s Take
The Crypto consolidation is nearing its end. Its during the quiet times that traders need to sit forward and pay attention since that is right before a big highly volatile move. In this instance the bias continues to remain towards the upside. Looking for a big expansive move up.