

📈📉 Stocks and Crypto Are About to SOAR!
📈📉 Stocks and Crypto Are About to SOAR!
PLUS: The DXY is Approaching a KEY Area!
Overview
Chart #1 - Theta Network (THETAUSDT) Daily
Chart #2 - S&P 500 Futures (ES1!) Weekly
Chart #3 - U.S. Dollar (DXY) Weekly
Chart #4 - Ethereum (ETHUSDT) Daily
Chart #5 - Fear and Greed Index
Chart #1 - Theta Network (THETAUSDT) Daily
Chartist: Sheldon
(For the chart screenshot, click here.)
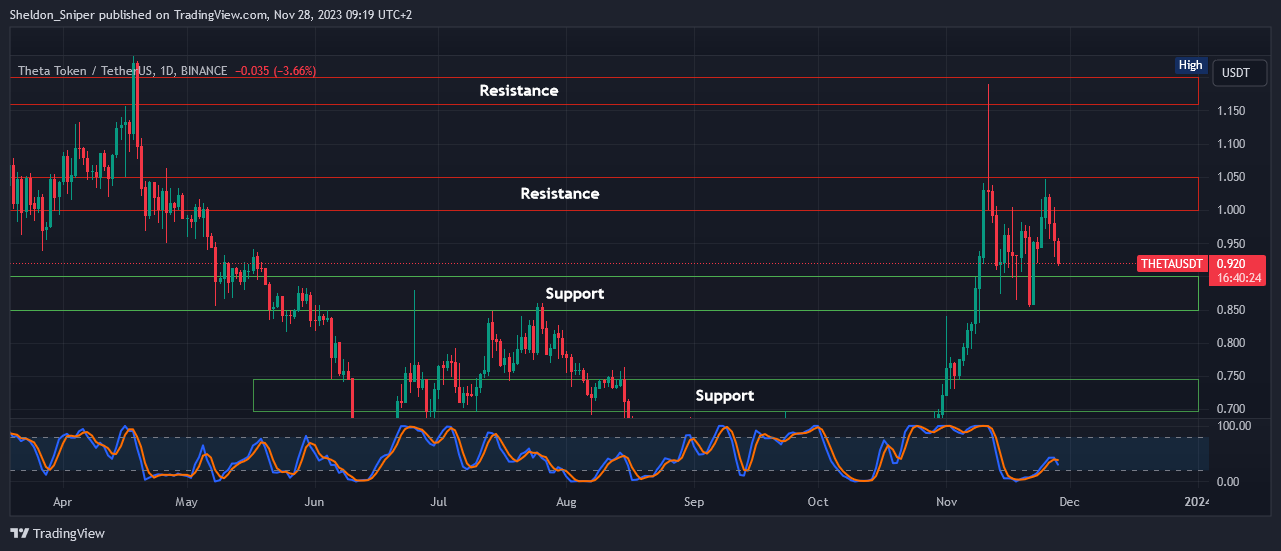
Over the last four days THETA has retraced down to $0.92.
It’s getting very close to the next area of support at $0.85 - $0.90, and if it can stabilize and hold here, I will take a long spot trade, with a target of roughly $1.20 - $1.30.
My stop loss will be set at $0.80.
Sign-up and trade on Bybit today.
Exclusive $30,000 deposit rewards and bonuses up for grabs!
Chart #2 - S&P 500 Futures (ES1!) Weekly
Chartist: Kyle
(For the chart screenshot, click here.)
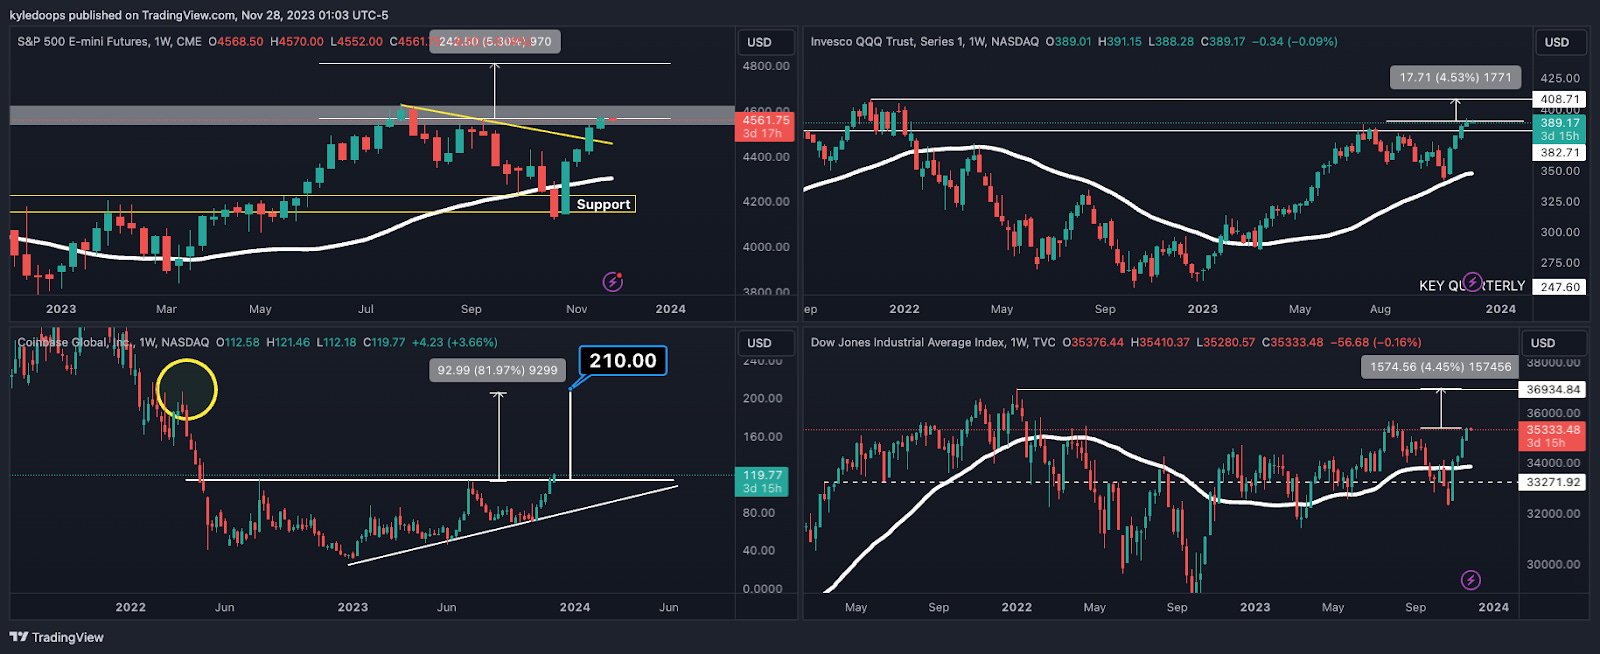
Traditional markets are looking strong; they have just come off of a major bounce, setting a significant low in October.
The charts discussed are from top left to top right to bottom right and then bottom left: S&P500 futures, Nasdaq, Dow Jones, and then Coinbase.
Major stock markets have come within 5% of making all-time highs; any time this happens, it’s a matter of months before they go on to break those highs. Currently, they have pushed into resistance, so a temporary consolidation or pullback could be warranted here.
Coinbase is currently breaking out of a long-term ascending triangle and has a measured move of 82% to reach its intended target of $210.
Once these stock markets move to all-time highs, crypto likely follows.
Claim your Bitget sign-up bonuses here (details below).

Outsmart 99% Of The Market!
Get full access into our Discord And Telegram group, where you'll find all of our premium content!
👉 Trade Signals!
👉 Trade Set-Ups!
👉 Trading Challenges!
👉 Education!
👉 SO MUCH MORE!
Chart #3 - U.S. Dollar (DXY) Weekly
Chartist: Kyle
(For the chart screenshot, click here.)
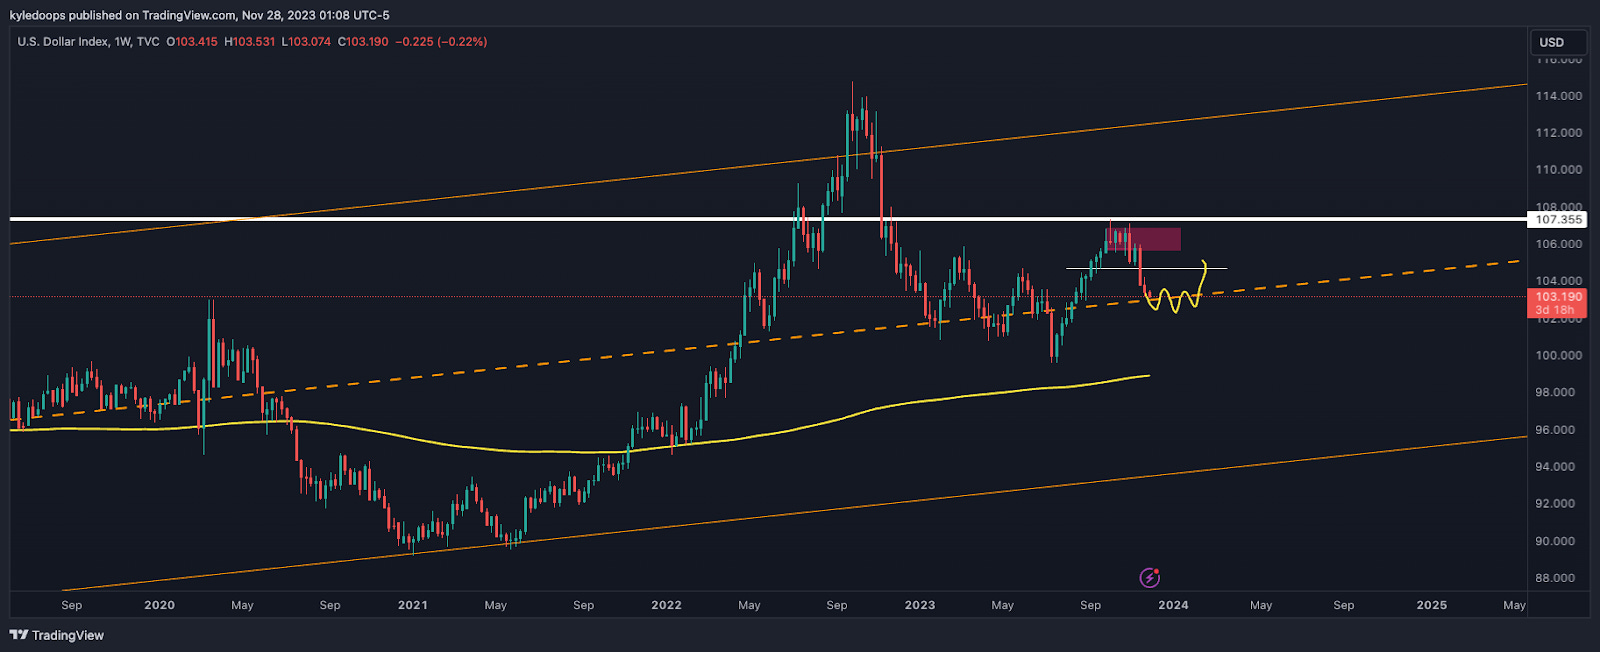
The DXY weekly chart is coming into a significant area this week, which could lead to a bounce.
This is a very high timeframe and, historically speaking, when the DXY oscillates around this mid-range level, it tends to react off of this level.
That reaction could be what triggers a shorter-term healthy correction in the stock market.
Claim your Bitget sign-up bonuses here (details below).
Chart #4 - Ethereum (ETHUSDT) Daily
Chartist: Sheldon
(For the chart screenshot, click here.)
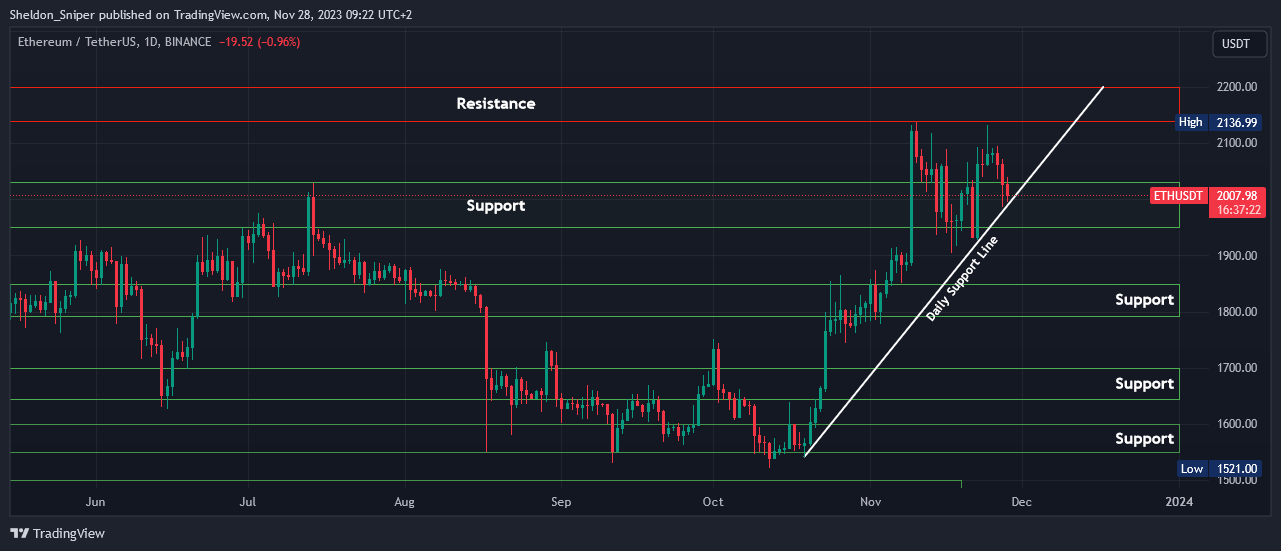
At the end of last week, ETH got rejected at $2,130, and since then has retraced down to the $1,950 - $2,025 area of support, also testing the daily ascending support line from mid-October.
If it can hold in this area of support, I am looking for it to once again go up to test the next area of resistance at $2,130 - $2,200.
Claim your Bitget sign-up bonuses here (details below).
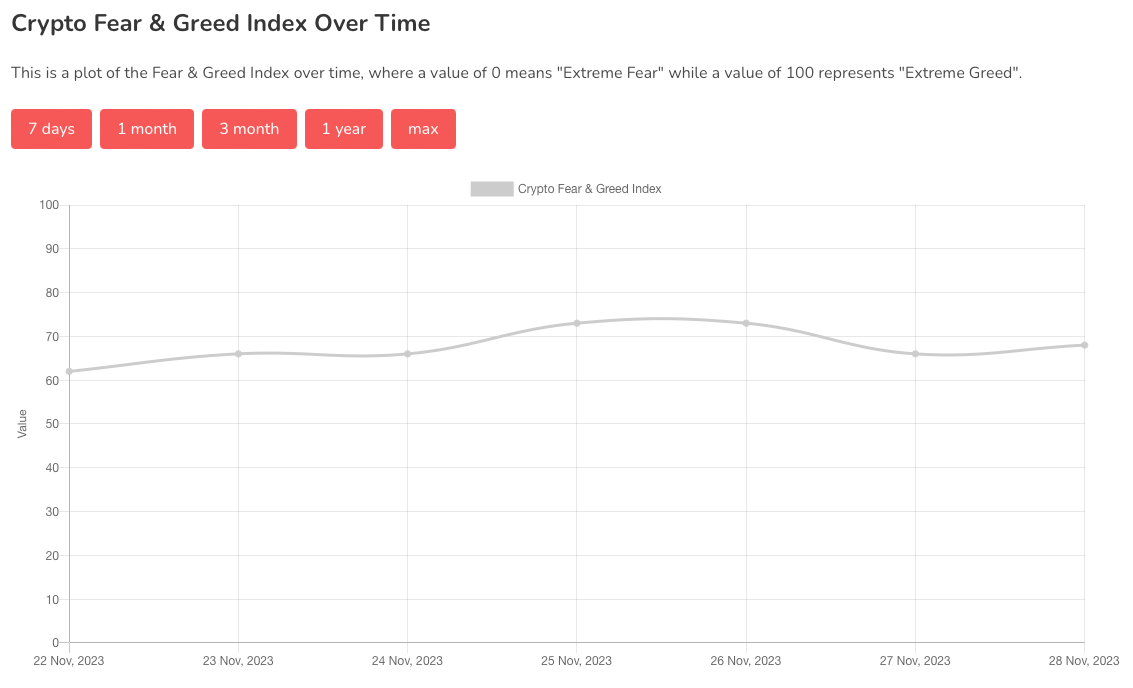
Chart #5 - Fear and Greed Index
The Fear and Greed Index is sitting at 68 today, indicating Greed.
The highest the index has been over the past seven days is 73, and the lowest is 62.
Banter’s Take
Both high and medium timeframe crypto is still bullish, low timeframe… it's bearish.
Investors might consider allocating into the next high and medium timeframe higher low, and traders may look to long on a break of structure back to the upside, thus trading in line with the broader trend.
Stay safe my friends!
Go to our Crypto Banter Discord here where Sheldon and Kyle give updates on the charts and trades from The Daily Candle newsletter!