

📈📉 SUI and GLMR Long Trade Setups!
📈📉 SUI and GLMR Long Trade Setups!
CAUTION: The Market is Becoming Heated!
Overview
Chart #1 - S&P 500 (SPX) Daily
Chart #2 - Moonbeam (GLMRUSDT) Daily
Chart #3 - Sui (SUIUSD) Daily
Chart #4 - GALA (GALAUSDT) Daily
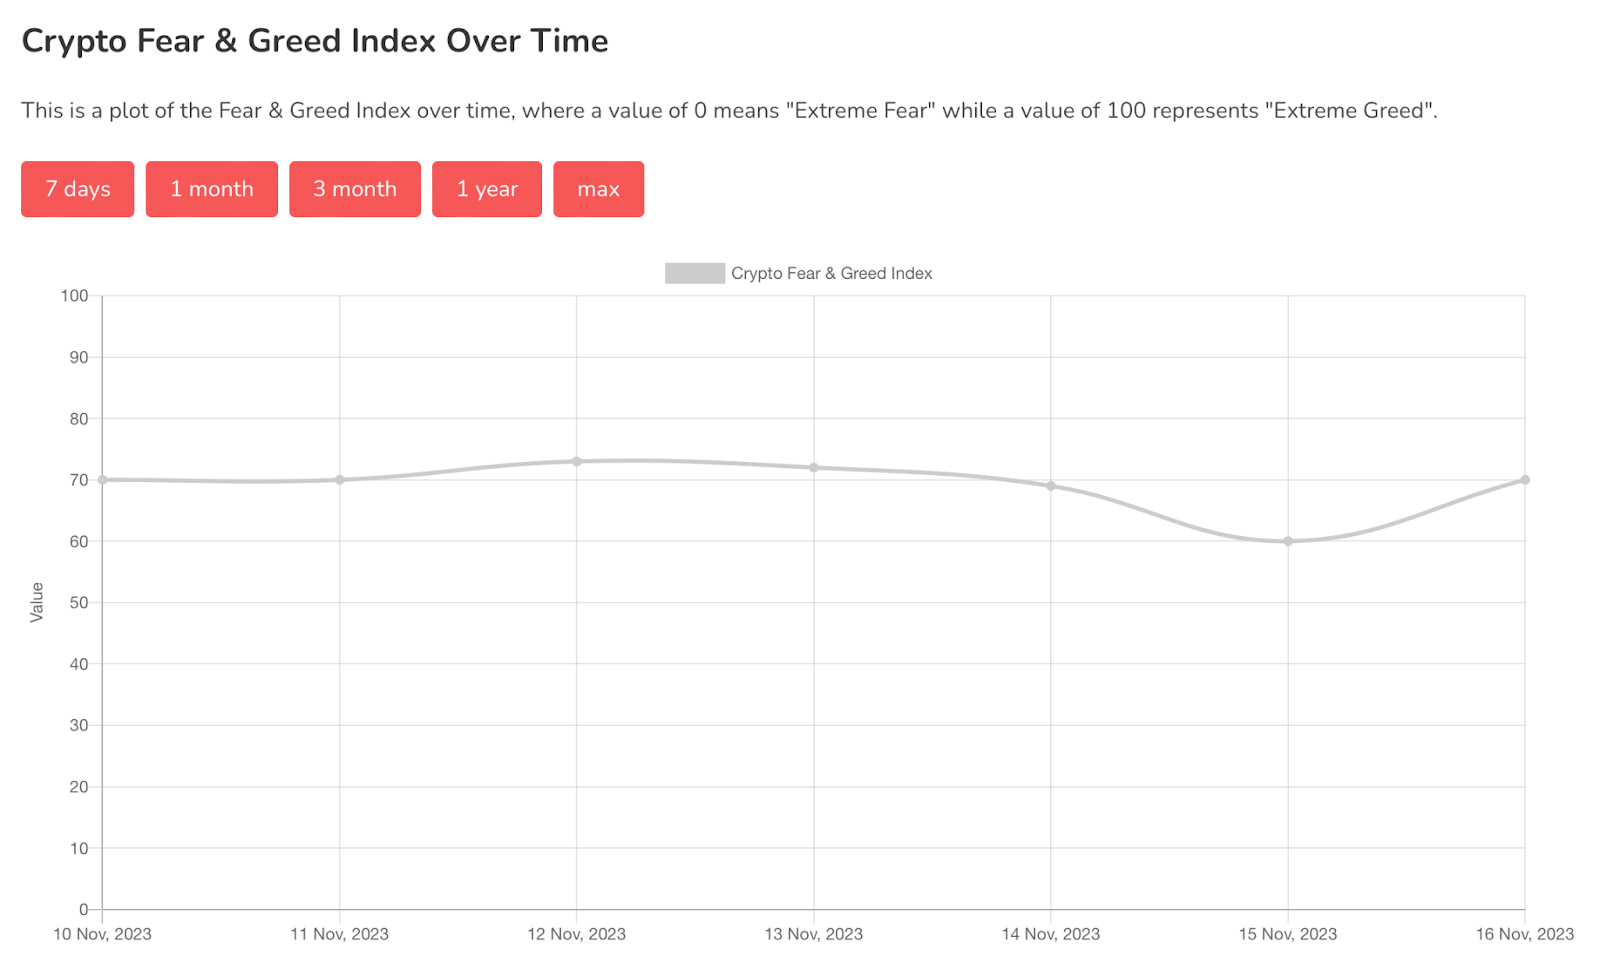
Chart #5 - Fear and Greed Index
Chart #1 - S&P 500 (SPX) Daily
Chartist: Sheldon
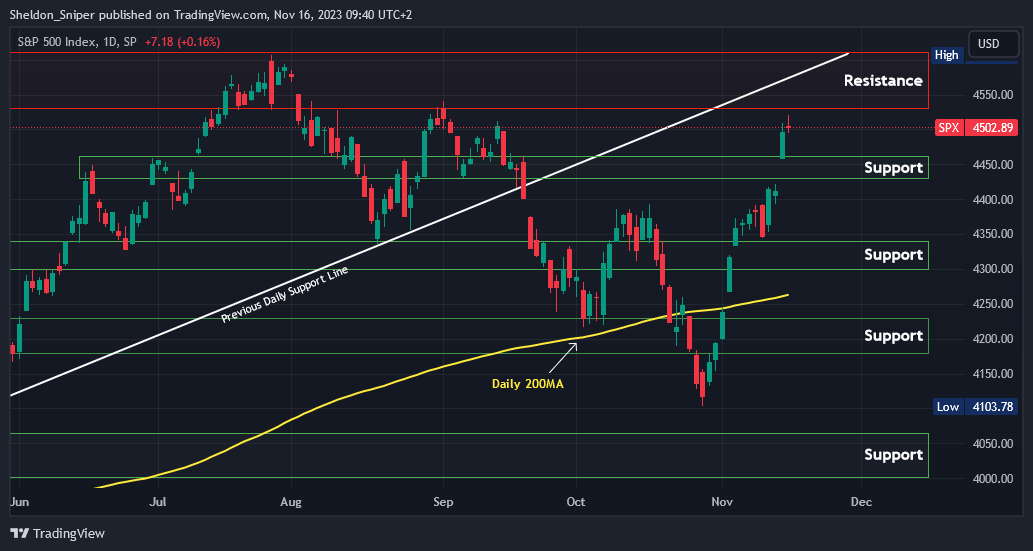
(For the chart screenshot, click here.)
Yesterday, the SXP got rejected at 4,520 and has started moving to the downside to test 4,430 - 4,460. If this doesn’t hold, it might head to 4,300 - 4,345.
If 4,430 - 4,460 can hold, there could be another leg to the upside, to around 4,550.
Keep in mind that there is a lot of talk amongst traders of possible downside in the US stock markets, that could possibly also affect the crypto.
Sign-up and trade on Bybit today.
Exclusive $30,000 deposit rewards and bonuses up for grabs!
Chart #2 - Moonbeam (GLMRUSDT) Daily
Chartist: Kyle
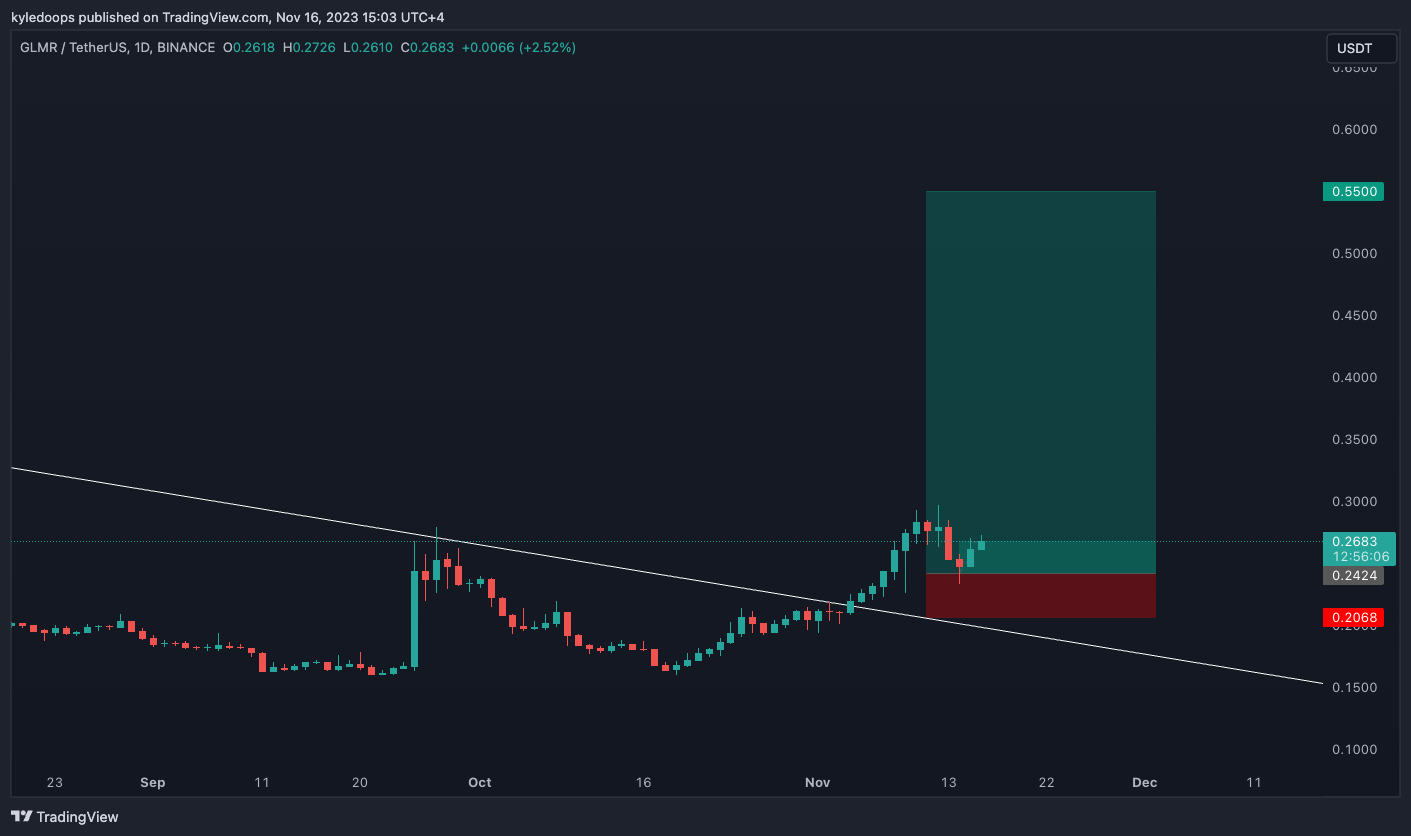
(For the chart screenshot, click here.)
For those who missed out on the first trade, this is another opportunity to get in off what looks to be a higher low in the making.
This would be our second position, which you could consider an opportunity to compound into the trade.
Stop at $0.20, initial entry was $0.24; late participants will need to enter here. Take profit at $0.55.
Claim your Bitget sign-up bonuses here (details below).

Outsmart 99% Of The Market!
Get full access into our Discord And Telegram group, where you'll find all of our premium content!
👉 Trade Signals!
👉 Trade Set-Ups!
👉 Trading Challenges!
👉 Education!
👉 SO MUCH MORE!
Chart #3 - Sui (SUIUSD) Daily
Chartist: Kyle
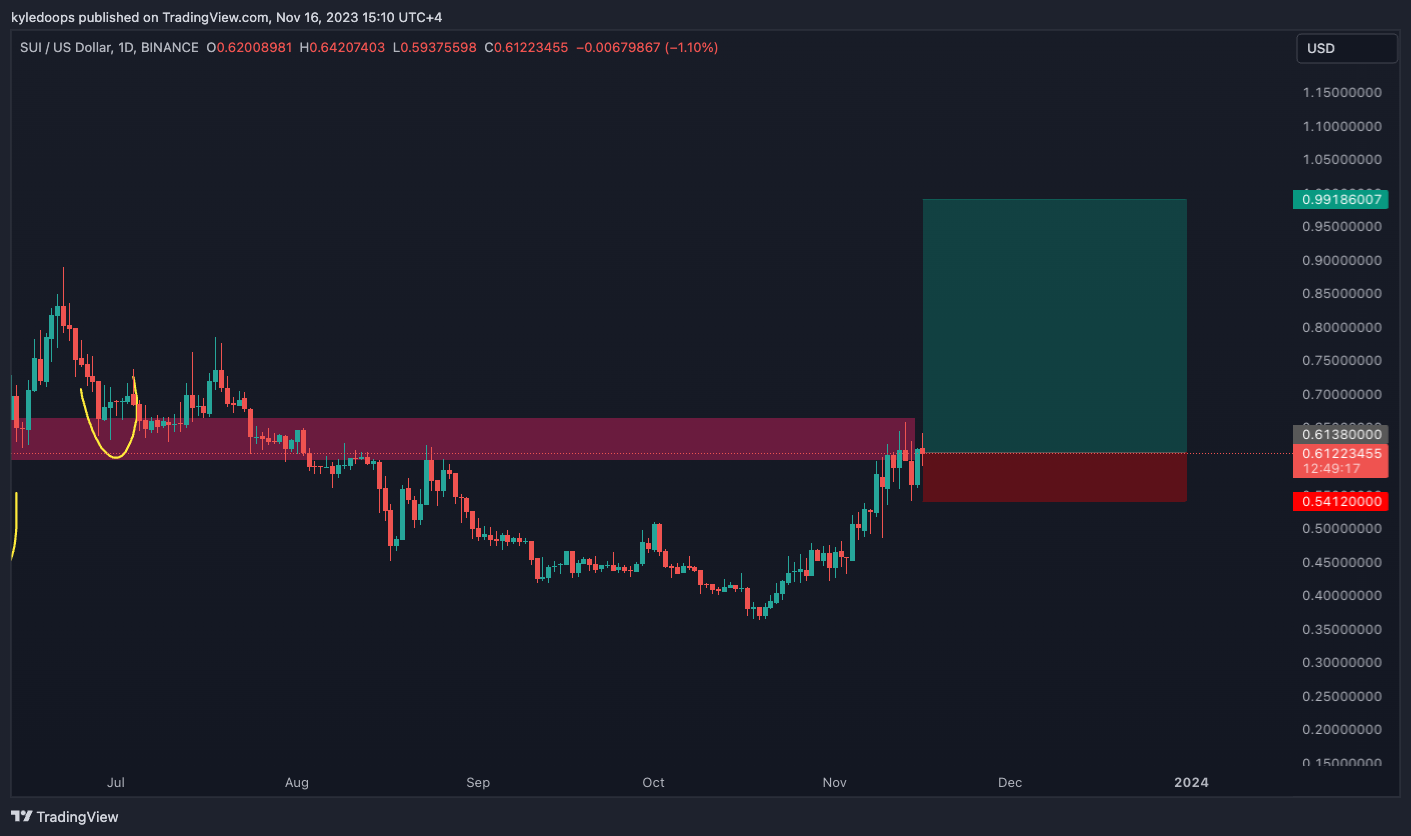
(For the chart screenshot, click here.)
This was a prior trade we had, which is also right at entry.
Long SUI from $0.612, up to $0.99, with a stop loss at $0.54.
Claim your Bitget sign-up bonuses here (details below).
Chart #4 - GALA (GALAUSDT) Daily
Chartist: Sheldon
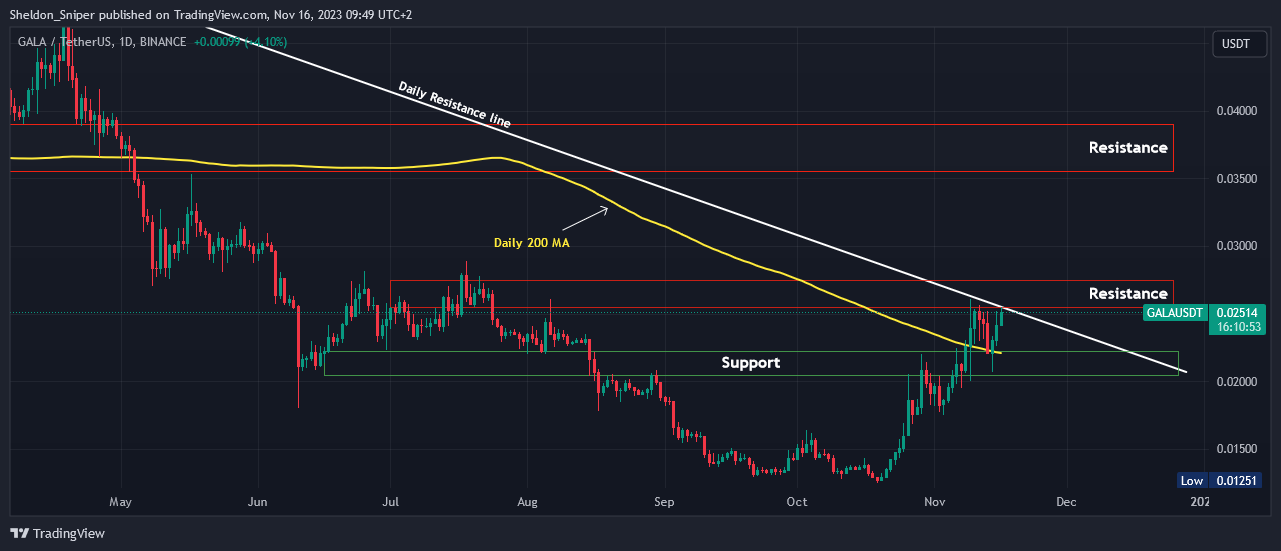
(For the chart screenshot, click here.)
I am watching GALA very closely; it is currently at its descending resistance line and the $0.02550 - $0.02750 area of resistance.
A breakthrough could send the price to $0.035 - $0.0385.
If it gets rejected here, the next area of support is between $0.02070 – $0.022, at the daily 200 Moving Average (MA).
Claim your Bitget sign-up bonuses here (details below).
Chart #5 - Fear and Greed Index
The Fear and Greed Index is sitting at 70 today, indicating Greed.
The highest the index has been over the past seven days is 73, and the lowest is 60.
Banter’s Take
Although there are opportunities, the market is becoming quite heated, so you would be taking increased risk by entering positions right now. Market participants are encouraged to exercise caution when getting into new positions. Since most coins have moved up substantially, there will be inevitable profit-taking in the days to come.