

📈📉 SUI Breaks Downtrend! Time To Go LONG!
📈📉 SUI Breaks Downtrend! Time To Go LONG!

Overview:
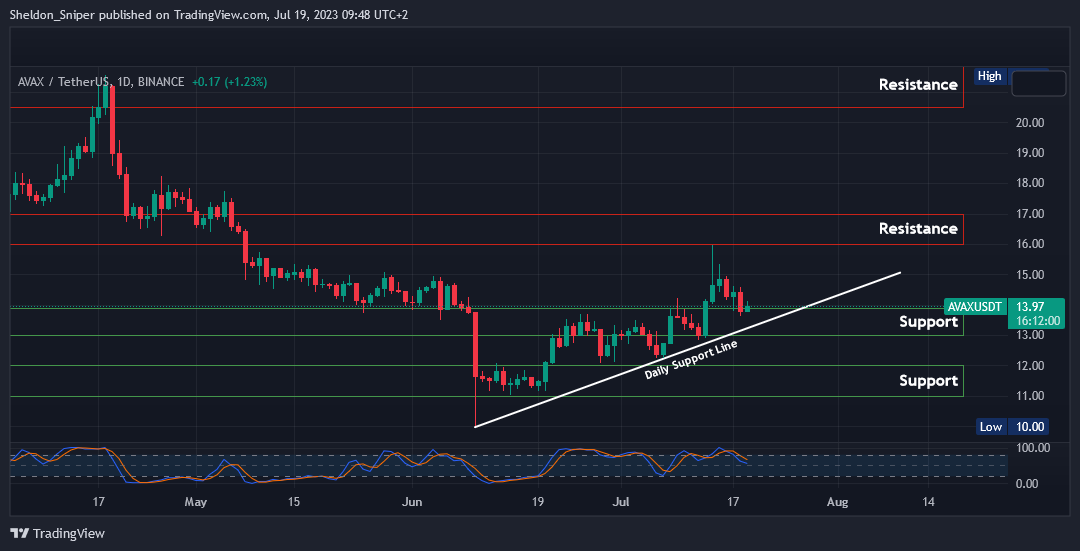
Chart #1 - Avalanche (AVAXUSDT) 1-Day Chart
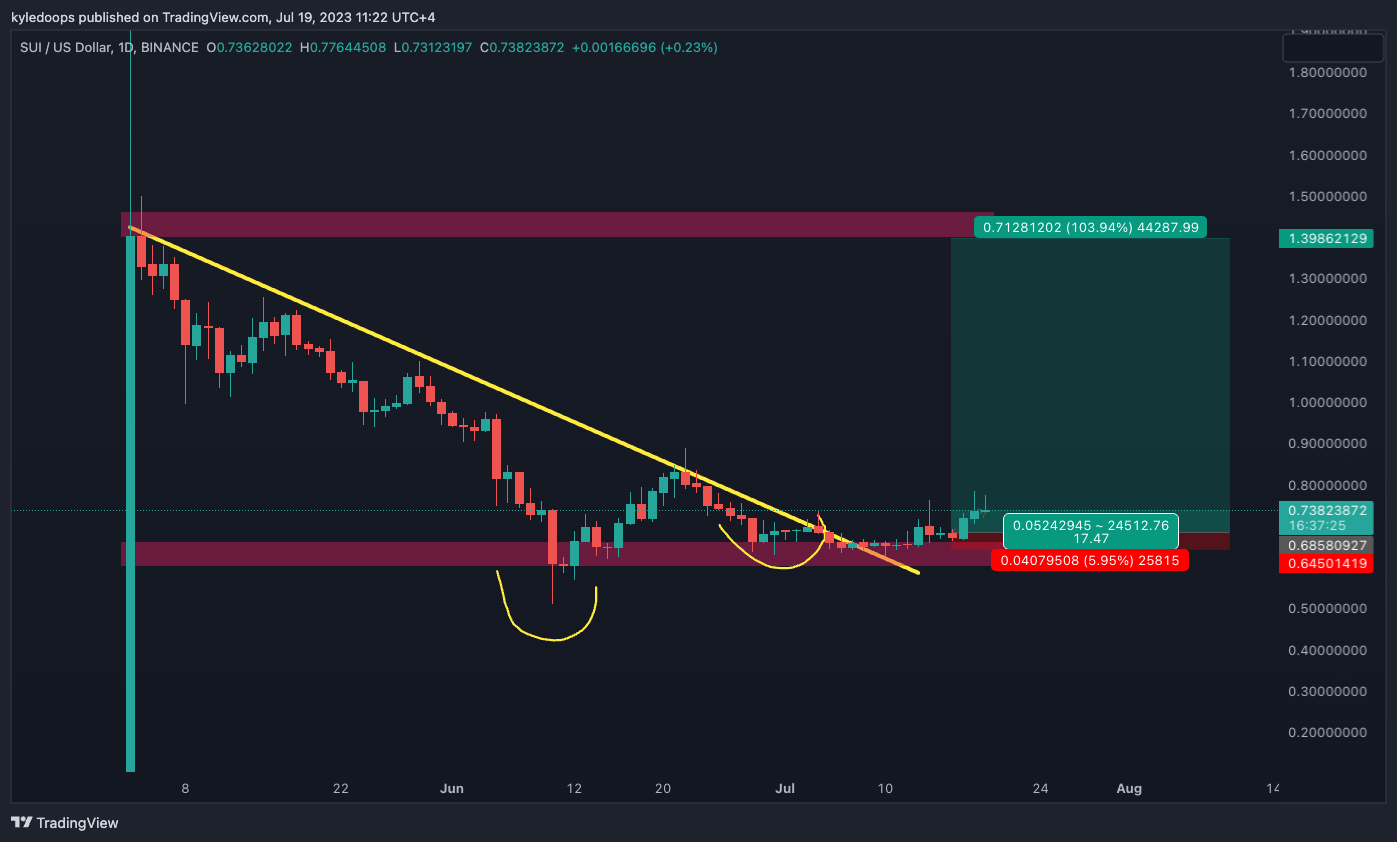
Chart #2 - Sui (SUIUSD) 1-Day Chart
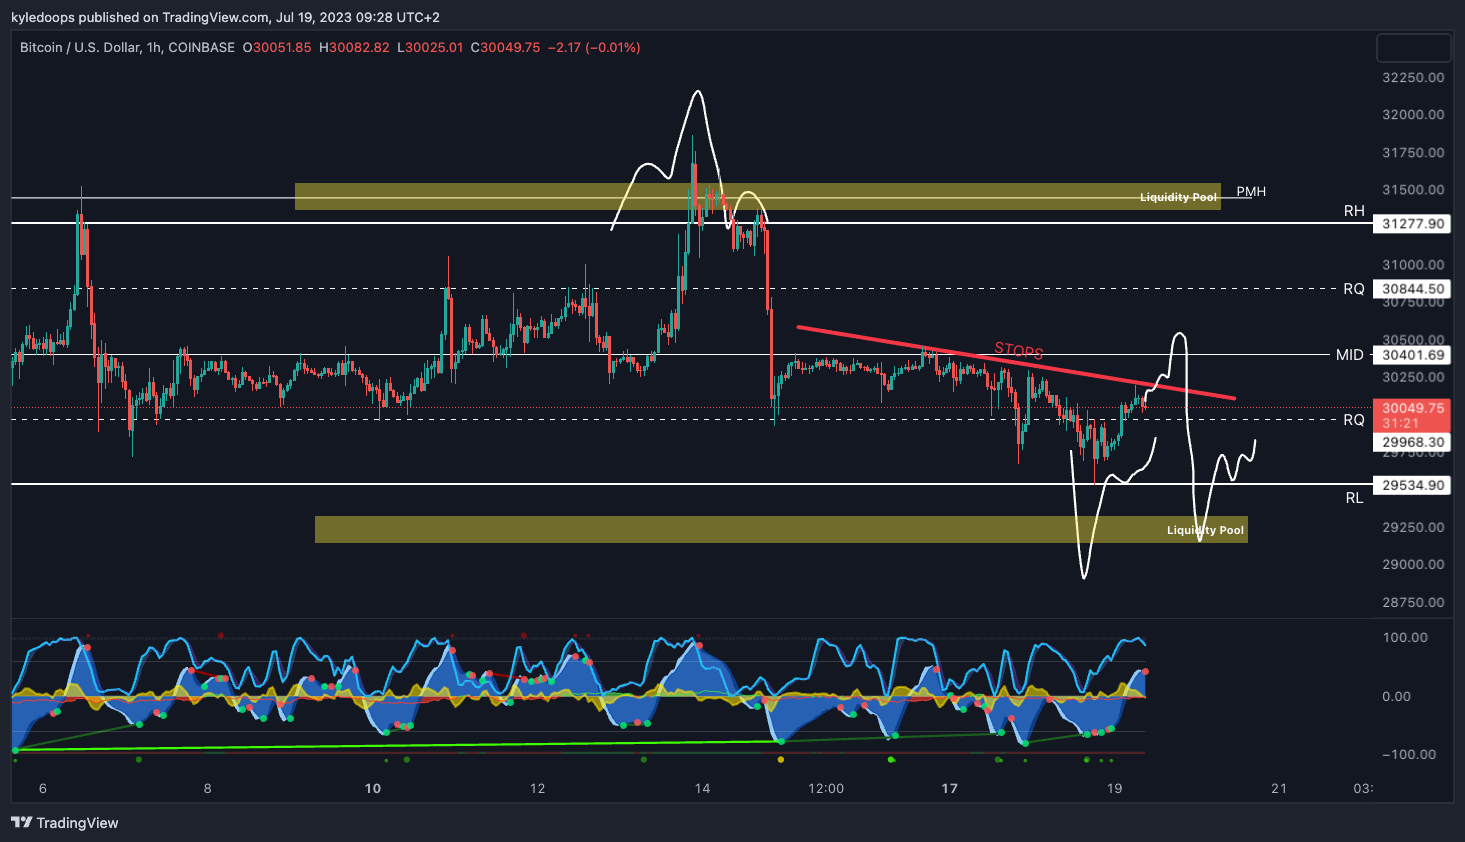
Chart #3 - Bitcoin (BTCUSD) 1-Hour Chart
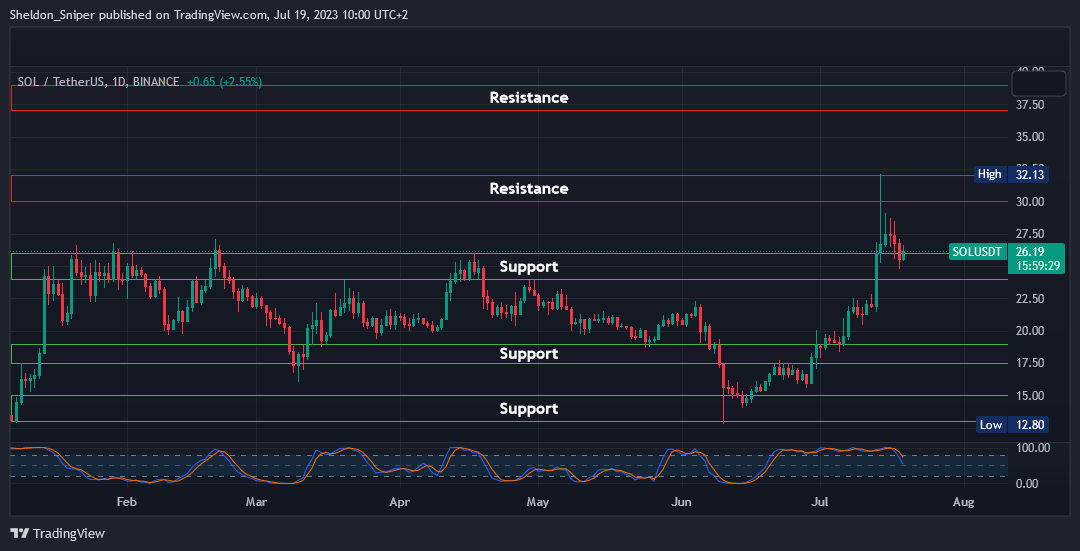
Chart #4 - Solana (SOLUSDT) 1-Day Chart
Chart #5 - Bitcoin Fear and Greed Index

Real Vision membership packages help you understand the complex world of crypto and macro, with real in-depth analysis!
Get your membership package 👉 here, and benefit from SPECIAL Crypto Banter discounted prices!
Chart #1 - Avalanche (AVAXUSDT) 1-Day Chart
Chartist: Sheldon
(For the chart screenshot, click here.)
After encountering resistance at $16 last week, AVAX has retraced to the next support area between $13 - $14.
I anticipate that the price will stabilize here and possibly set up for the next upward push. This would once again test the next resistance at $16 - $17, and potentially even reach the $21 - $22 area afterwards.
If the $13 - $14 support area and the daily ascending support line are both breached to the downside, then the next support area is at $11 - $12, a region last tested in June.
AVAX's price has been lagging behind some of the other layer-1 platforms, and I expect a significant rise in AVAX's price over the next couple of weeks.
Sign-up and trade on Bybit today.
Exclusive $30,000 deposit rewards and bonuses up for grabs!
Chart #2 - Sui (SUIUSD) 1-Day Chart
Chartist: Kyle
(For the chart screenshot, click here.)
SUI has broken its long-term downtrend and is now moving sideways. It's also holding the range low and could potentially be accumulating.
Trading it, a stop loss would be set below Monday's low at $0.645. The take profit strategy appears very aggressive here, but it should be constantly re-evaluated. Half of the profits would be taken at the mid-range at $1, and full profits would be realized if the price ascends to $1.40.
𝗣𝗿𝗶𝗺𝗲 𝗫𝗕𝗧
Sign up for a new Trading Account on Prime XBT!
Receive a deposit bonus of up to $7,000 with promo code: KyleDoops

Sign up for a new Trading Account on Prime XBT!
Receive a deposit bonus of up to $7,000 with promo code: SheldonSniper
Chart #3 - Bitcoin (BTCUSD) 1-Hour Chart
Chartist: Kyle
(For the chart screenshot, click here.)
Bitcoin continues to consolidate within a range, with its price capped below the mid-range level at $30,500.
Currently, there are $9 billion worth of shorts to be squeezed, suggesting that we may see a spike above $30,500 to eliminate these shorts.
Afterwards, the price is likely to move in the opposite direction again to tap into the $29,200 liquidity.
Claim your Bitget sign-up bonuses here (details below).
Chart #4 - Solana (SOLUSDT) 1-Day Chart
Chartist: Sheldon
(For the chart screenshot, click here.)
Last week, SOL experienced a substantial rally to the upside, rising from around $22 to $32 in just two days.
The price has since retraced to the $24 - $26 support area, and for now, it has converted the current year's range-high resistance of $26 into support. It appears the price may stabilize in this area, possibly testing the next resistance at $30 - $32, or even the area following that at $37 - $39, over the next few weeks.
SOL has been incredibly bullish over the last couple of weeks, and I believe there is a lot more upward potential for it.
Claim your Bitget sign-up bonuses here (details below).
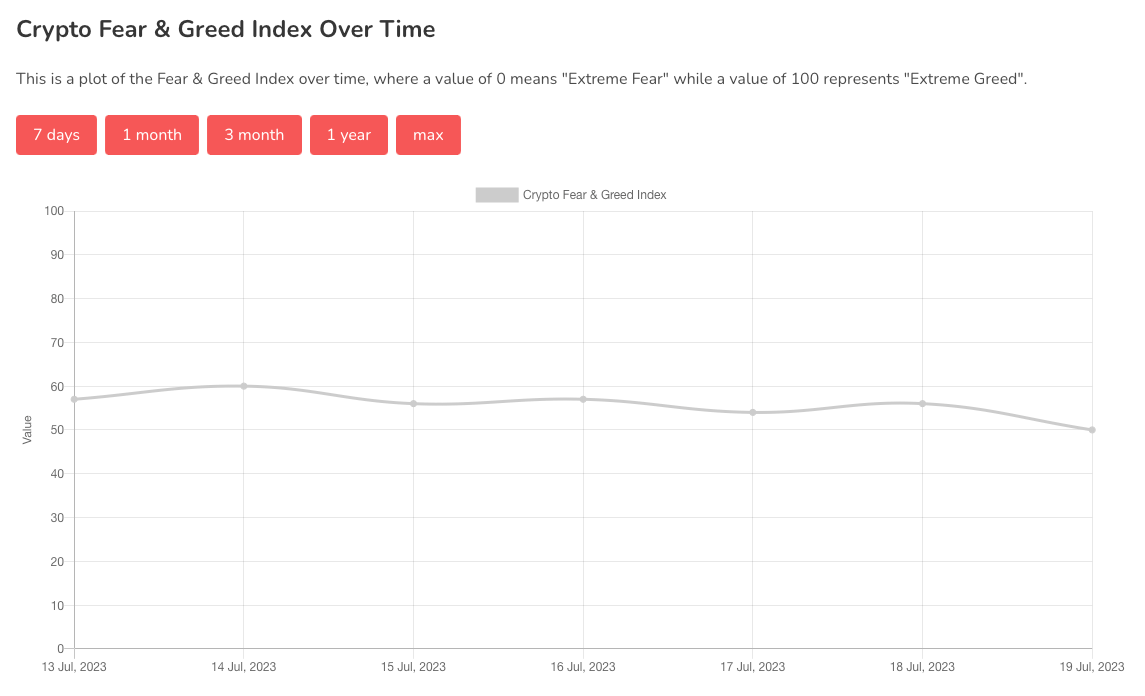
Chart #5 - Bitcoin Fear and Greed Index
The Bitcoin Fear and Greed Index is sitting at 50 today, Neutral.
The highest the index has been over the past seven days is 60, and the lowest is 50.
Banter’s Take
On a higher timeframe, Bitcoin continues to grapple with the $30,000 level. However, some bearish divergences are beginning to emerge. If these play out, prices are likely to move into the $28,000 region.
Stay safe my friends!
Go to our Crypto Banter Discord here where Sheldon and Kyle give updates on the charts and trades from The Daily Candle newsletter!