

📈📉 The DXY about to Crash Stocks and Crypto?
📈📉 The DXY about to Crash Stocks and Crypto?

Overview
Chart #1 - Crypto Total Market Cap (TOTAL) Daily Chart
Chart #2 - U.S. Dollar (DXY) Daily Chart
Chart #3 - S&P 500 Futures (ES1!) Daily Chart
Chart #4 - Bitcoin (BTCUSDT) Daily Chart
Chart #5 - Fear and Greed Index

Chart #1 - Crypto Total Market Cap (TOTAL) Daily Chart
Chartist: Sheldon
(For the chart screenshot, click here.)
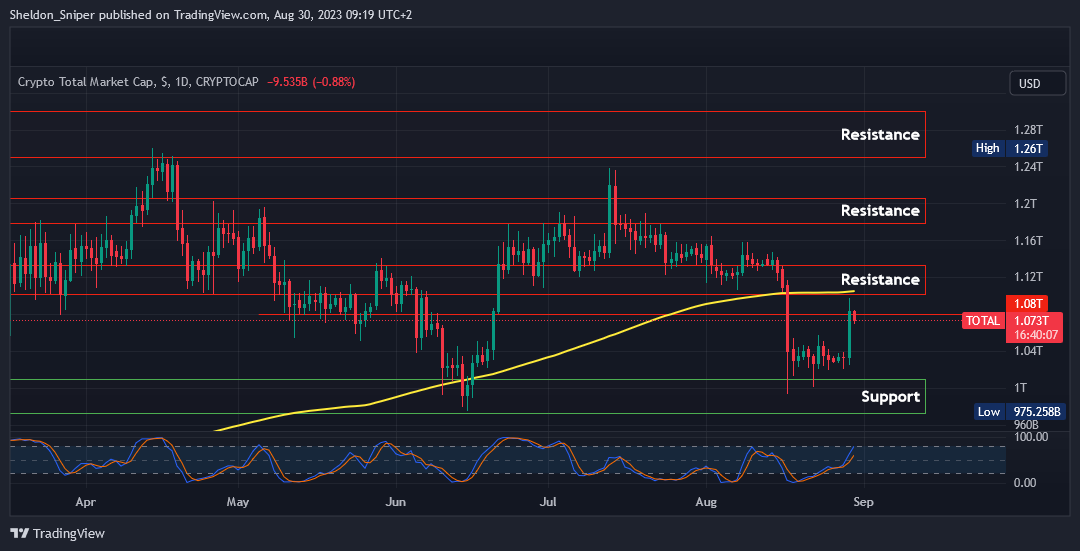
Yesterday, the TOTAL made a move higher after spending two weeks in a tight range between a low support at around $1.2T and a high resistance area of $1.06T. The market continued to rally to the next level of resistance at $1.10T, where the daily 200 Moving Average can also be found, before getting rejected.
Currently at $1.073T, I feel there could be a move higher in the next couple of days, to test the $1.10T - $1.13T area of resistance. If it retraces further from here, there could be a test of the previous range high resistance area of $1.06T, which will now be acting as support.
𝗣𝗿𝗶𝗺𝗲 𝗫𝗕𝗧
Sign up for a new Trading Account on Prime XBT!
Receive a deposit bonus of up to $7,000 with promo code: SheldonSniper
Sign-up and trade on Bybit today.
Exclusive $30,000 deposit rewards and bonuses up for grabs!
Chart #2 - U.S. Dollar (DXY) Daily Chart
Chartist: Kyle
(For the chart screenshot, click here.)
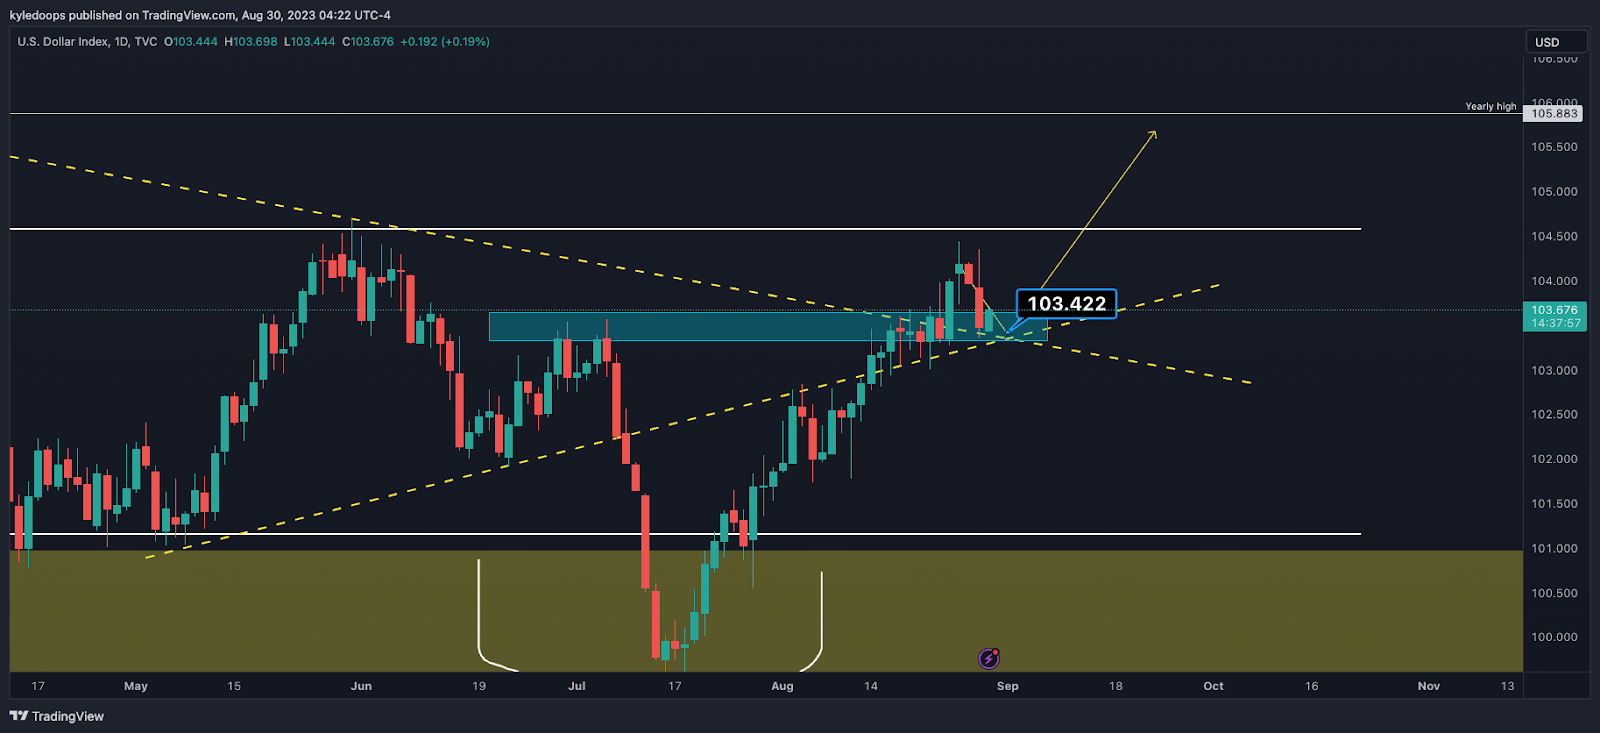
The DXY has come into the key area outlined previously.
What happens here next will be absolutely critical, as this is a strong back test into key support.
If the DXY bounces here, then Bitcoin could set in a lower high. So this is an important level to watch.
𝗣𝗿𝗶𝗺𝗲 𝗫𝗕𝗧
Sign up for a new Trading Account on Prime XBT!
Receive a deposit bonus of up to $7,000 with promo code: KyleDoops
Chart #3 - S&P 500 Futures (ES1!) Daily Chart
Chartist: Kyle

(For the chart screenshot, click here.)
The S&P 500 has reclaimed a key level!
If the price holds above this level, then it opens up the possibility to start a new trading range between 4,494 and 4,620.
Similar to Bitcoin, the ES1! will be affected by the DXY pumping.
Claim your Bitget sign-up bonuses here (details below).
Chart #4 - Bitcoin (BTCUSDT) Daily Chart
Chartist: Sheldon
(For the chart screenshot, click here.)
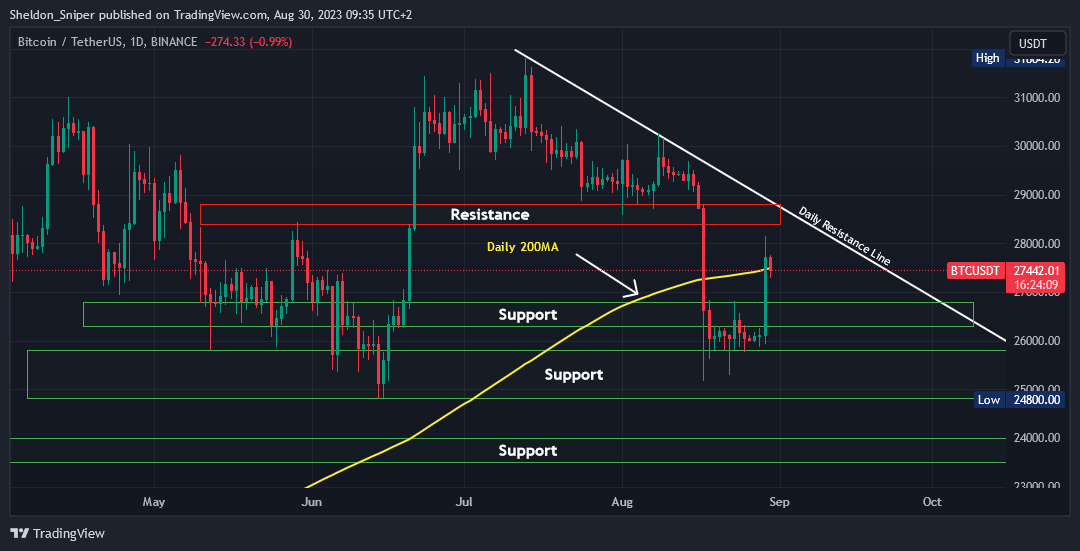
Yesterday, we saw an over 8.5% move in Bitcoin as the price rallied from $26,000 to just over $28,000, before finding resistance at both the daily and weekly 200 Moving Averages at around $27,500.
The $2,000 move in price was also assisted by late short traders closing their trades. I still feel that in the next couple of days, there will be another push higher, where possibly more short traders would have to cover their trades. Hopefully, the price will then be able to break through the current $27,500 - $28,000 major area of resistance, to then test $28,500 - $29,000, an area that previously held as support from July to mid-August.
The daily descending resistance line also intersects in the same $28,500 - $29,000 area and will be providing extra resistance in that area. If the price retraces from the current $27,400, it will head to $26,800.
Claim your Bitget sign-up bonuses here (details below).
Chart #5 - Fear and Greed Index
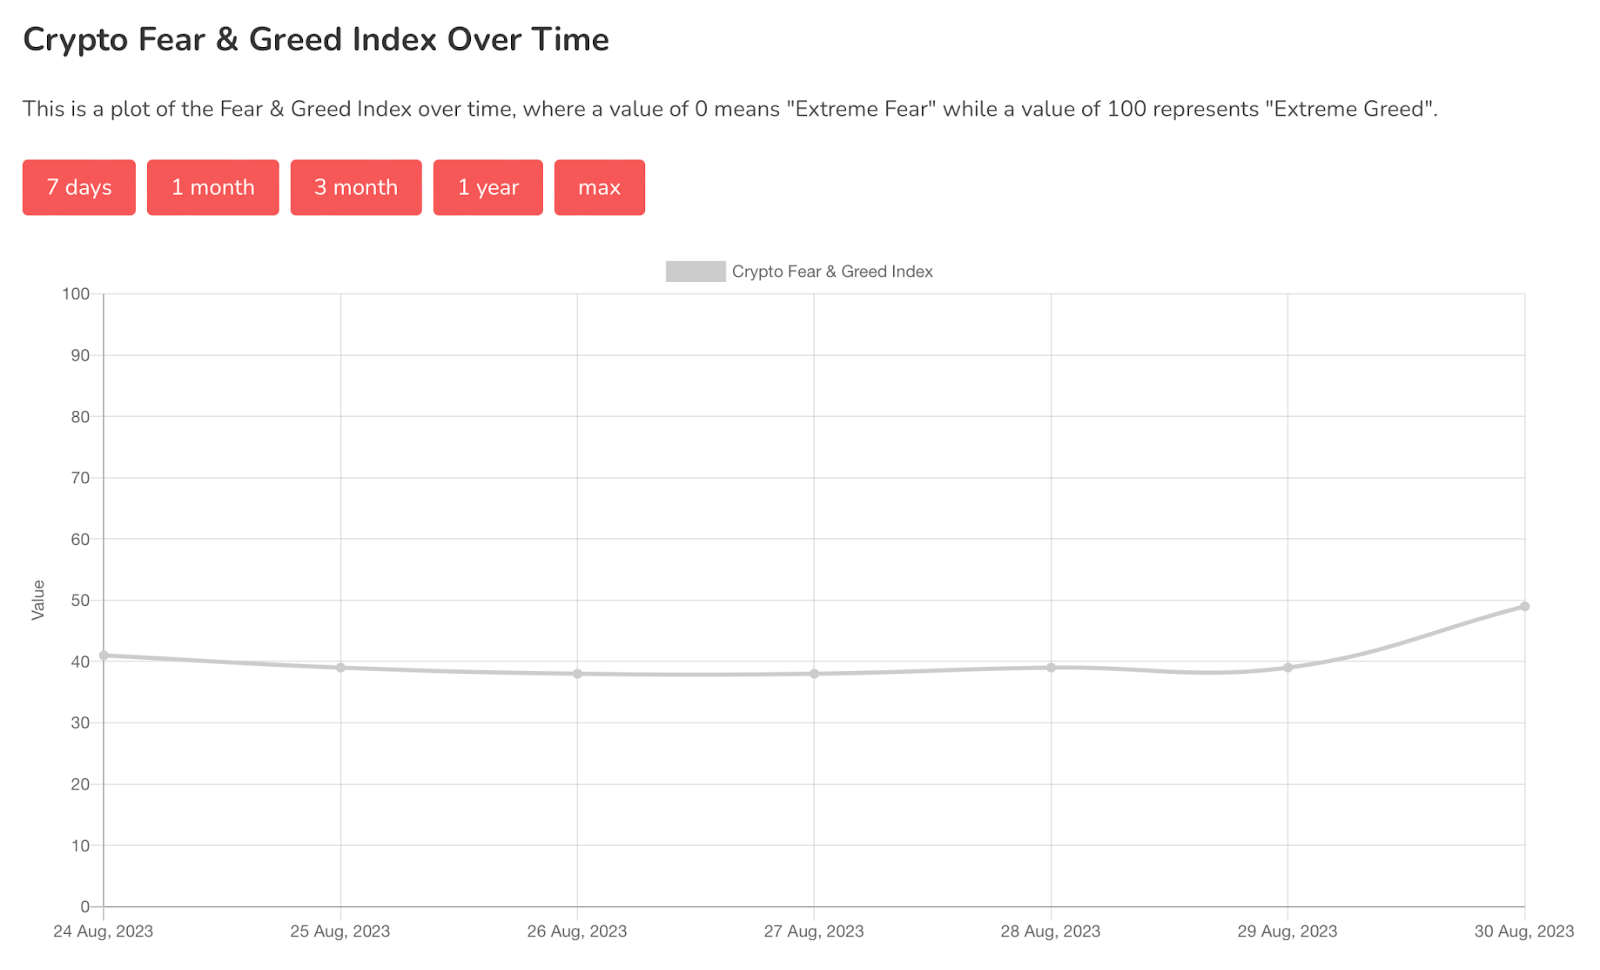
The Fear and Greed Index is sitting at 49 today, Neutral.
The highest the index has been over the past seven days is 49, and the lowest is 38.
Banter’s Take
The recent pump in Bitcoin could still be a trap. It's yet to confirm a full reversal. The weekly close will be critical. We’ll watch for lower highs!
Stay safe my friends!
Go to our Crypto Banter Discord here where Sheldon and Kyle give updates on the charts and trades from The Daily Candle newsletter!