

📈📉 The Only FOMC Trades We Are Watching Today!!
📈📉 The Only FOMC Trades We Are Watching Today!!

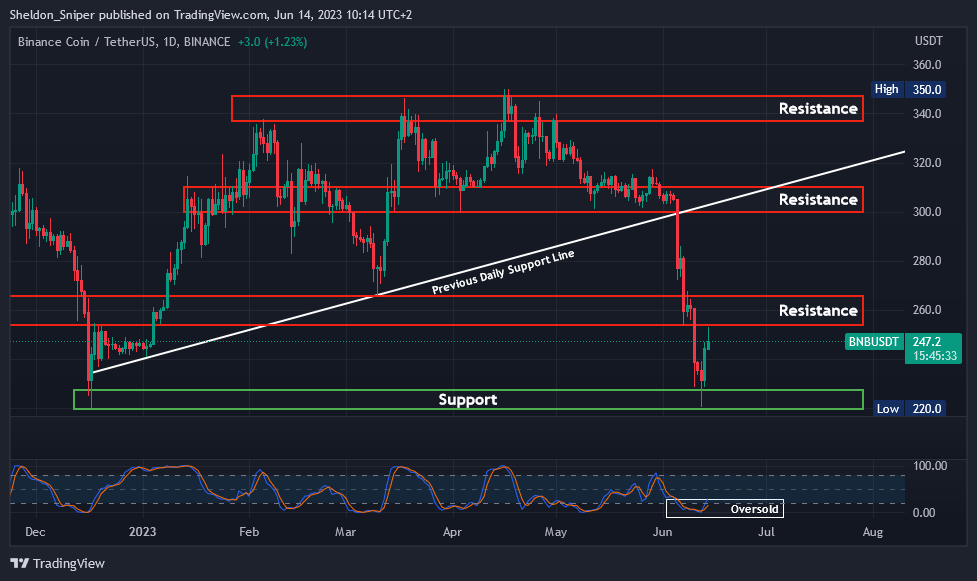
Chart #1 - BNB (BNBUSDT) 1-Day Chart
Chartist: Sheldon
(For the chart screenshot, click here.)
BNB has experienced a significant price drop over the past ten days. The fall followed the SEC's announcement of charges against Binance.US.
Over the period, the price fell from the its $300 support level down to $220 - a support level last visited at the end of last year. Also, the ascending daily support line, established at the start of the year, has been lost.
Right now, we are seeing that price is oversold on higher time frames, but we've observed a bullish trend over the past three days that has reversed the trajectory back up to $247.
BNB is now at the first resistance zone of $250 - $265. If it can break this barrier, it should make its way up to $280.
Sign-up and trade on Bybit today.
Exclusive $30,000 deposit rewards and bonuses up for grabs!
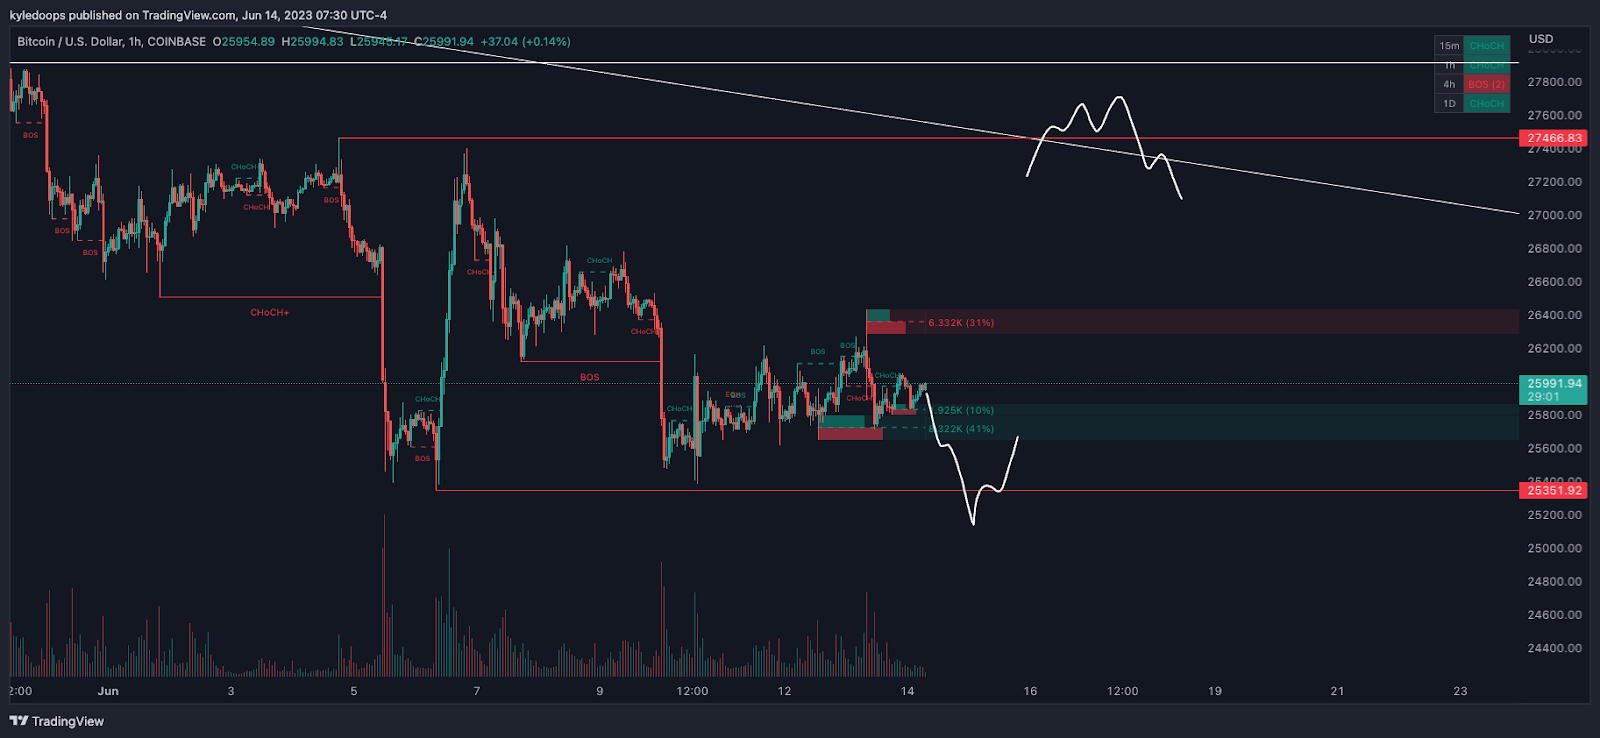
Chart #2 - Bitcoin (BTCUSD) 1-Hour Chart
Chartist: Kyle
(For the chart screenshot, click here.)
Today, I'll keep it simple due to the FOMC meeting and the expected volatility.
Bitcoin’s price is confined between two liquidity areas. The upper limit, or range high, is at $27,566. If the price exceeds this today and then falls back below, I would short.
Then, the lower limit, or range low, stands at $25,351. If the price falls below that level and then re-enters the range, I would go long.
I would not be interested in anything in between.
𝗣𝗿𝗶𝗺𝗲 𝗫𝗕𝗧
Sign up for a new Trading Account on Prime XBT!
Receive a deposit bonus of up to $7,000 with promo code: KyleDoops

Sign up for a new Trading Account on Prime XBT!
Receive a deposit bonus of up to $7,000 with promo code: SheldonSniper
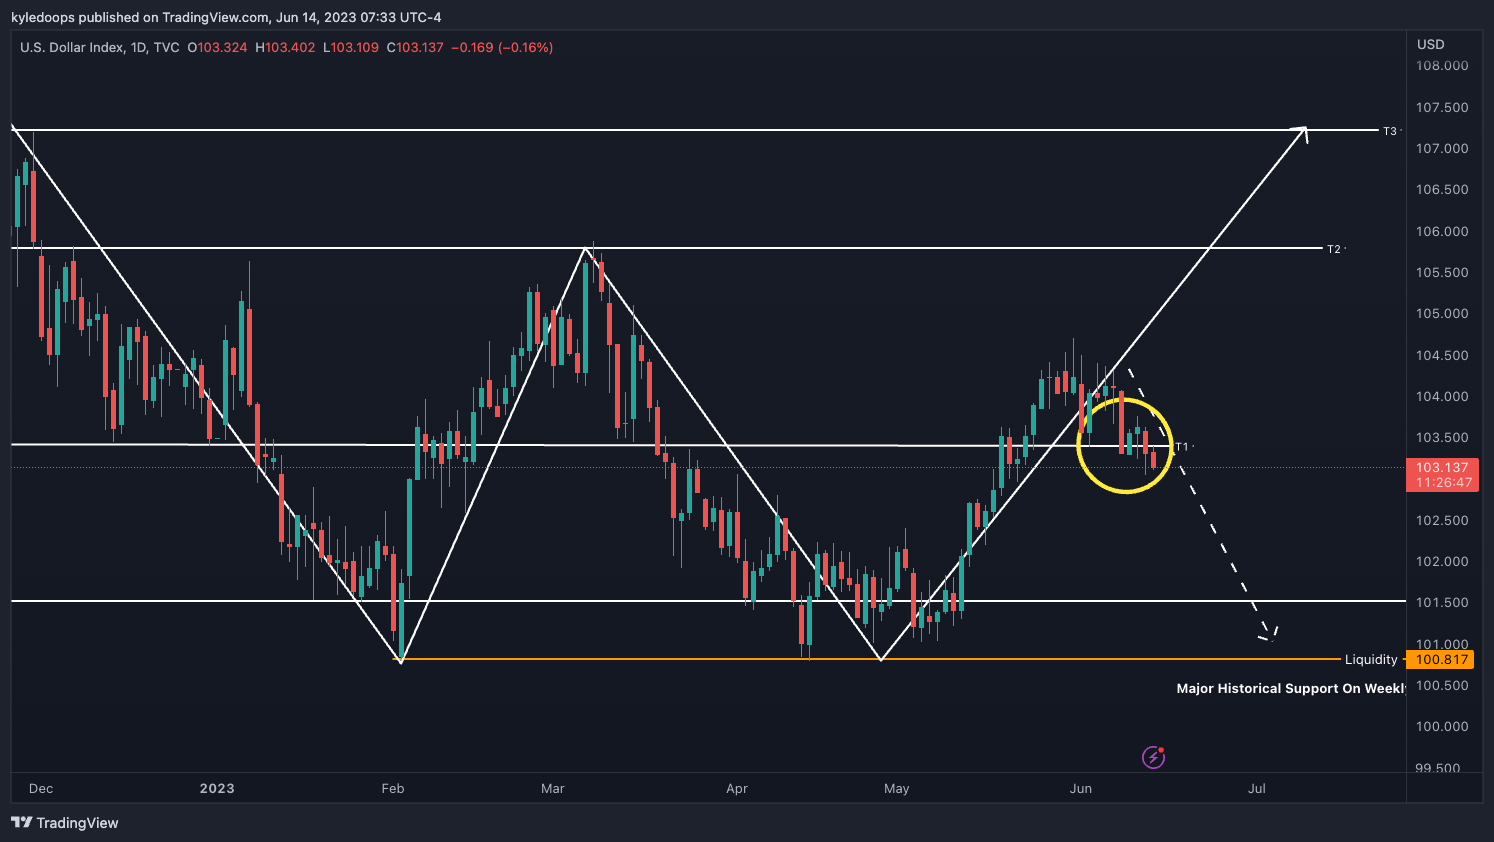
Chart #3 - U.S. Dollar (DXY) 1-Day Chart
Chartist: Kyle
(For the chart screenshot, click here.)
On the daily chart, the DXY continues to show signs of weakness, now confirming a break in structure to the downside.
This structural break suggests a continued decline. So, the next level to watch as minor support is at 102.50.
Lose that, and it’s a ride back down to 100.817.
Claim your Bitget sign-up bonuses here (details below).
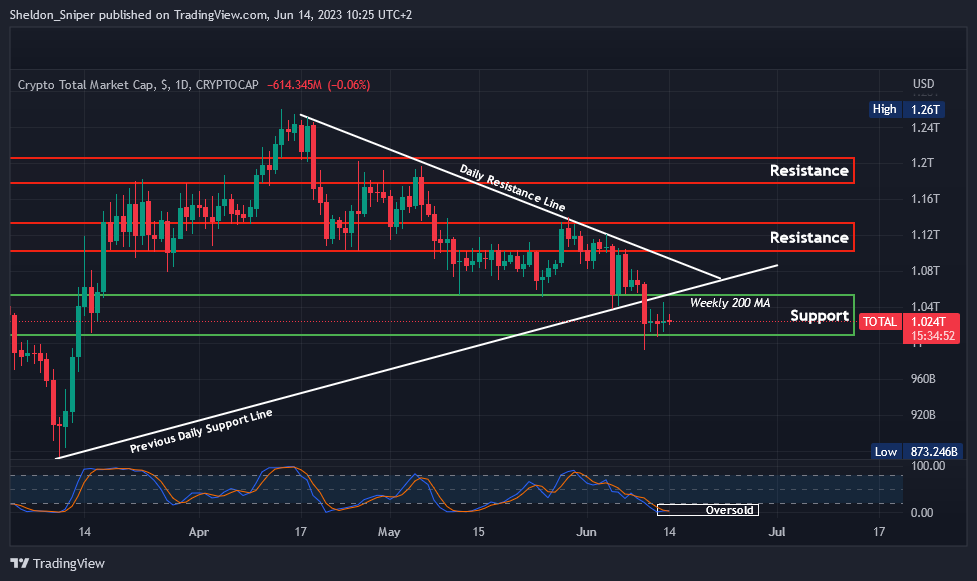
Chart #4 - TOTAL 1-Day Chart
Chartist: Sheldon
(For the chart screenshot, click here.)
This past week has been challenging for the Total Crypto Market Cap (TOTAL), as it broke two key indicators: the weekly 200 Moving Average (MA) and the daily ascending support line.
The TOTAL fell from $1.05T to below $1T during the period, though it has rebounded over the last three days to its current position at $1.024T. The market is oversold on higher time frames, so we might see a move back up to test both the previous $1.05T area and the prior daily support line, which will now serve as resistance.
But, if the TOTAL loses its $1T support level, the next one stands at $875B.
Claim your Bitget sign-up bonuses here (details below).
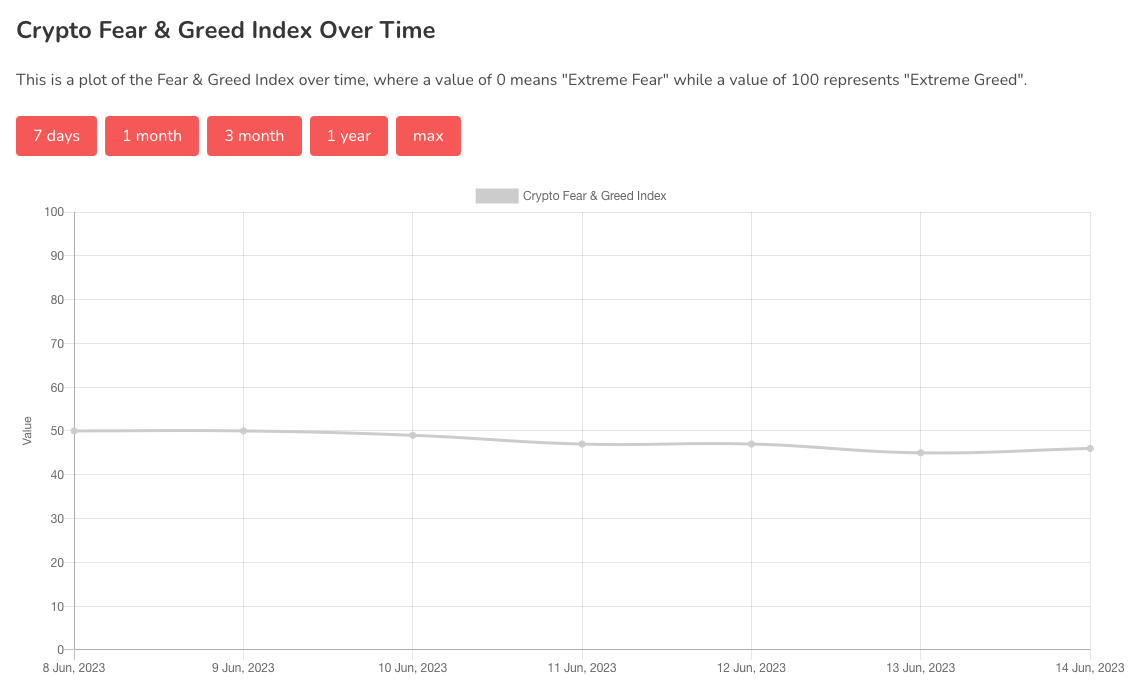
Chart #5 - Bitcoin Fear and Greed Index
The Bitcoin Fear and Greed Index is sitting at 46 today, indicating Fear.
The highest the index has been over the past seven days is 50, and the lowest is 45.
Banter’s Take
The FOMC meeting is sure to bring volatility. Once it’s over, the direction of price movements for new trades will become much clearer.
Despite the dollar showing signs of weakness and the stock market's continued surge, Bitcoin and alts are yet to demonstrate any significant bidding activity or strength.
Stay safe my friends!
Go to our Crypto Banter Discord here where Sheldon and Kyle give updates on the charts and trades from The Daily Candle newsletter!