


📈📉 The Perfect Level to Buy Bitcoin is at…

Chart #1 - Theta Network (THETAUSDT) 12-Hour Chart
Chartist: Sheldon

(For the chart screenshot, click here.)
A lot of alts have retraced down into key support areas, and one of them is THETA which is currently trading in its key support area of $0.84 - $0.87.
Price is oversold on the medium time frames. If it can hold support here, it should test its daily descending resistance line (from mid-April) at around $0.90. If THETA breaks the line, it will test the next major resistance area between $0.96 - $1.02, whereas a breach of the $0.84 level could possibly take the price right down to $0.78 - $0.80.
𝗣𝗿𝗶𝗺𝗲 𝗫𝗕𝗧
Sign up for a new Trading Account on Prime XBT!
Receive a deposit bonus of up to $7,000 with promo code: SheldonSniper
Chart #2 - Bitcoin (BTCUSD) 1-Day Chart
Chartist: Kyle

(For the chart screenshot, click here.)
Bitcoin continues to distribute, with the price now stuck below the key monthly level of $26,965, showing downward pressure.
Although there is some support at $25,000, the sweet spot to acquire spot positions would be at $22,808. That level aligns with the 200-day moving average (MA) as well as the diagonal trend line, which would coincide with the third touch.
𝗣𝗿𝗶𝗺𝗲 𝗫𝗕𝗧
Sign up for a new Trading Account on Prime XBT!
Receive a deposit bonus of up to $7,000 with promo code: KyleDoops

Chart #3 - Litecoin (LTCUSD) 1-Day Chart
Chartist: Kyle
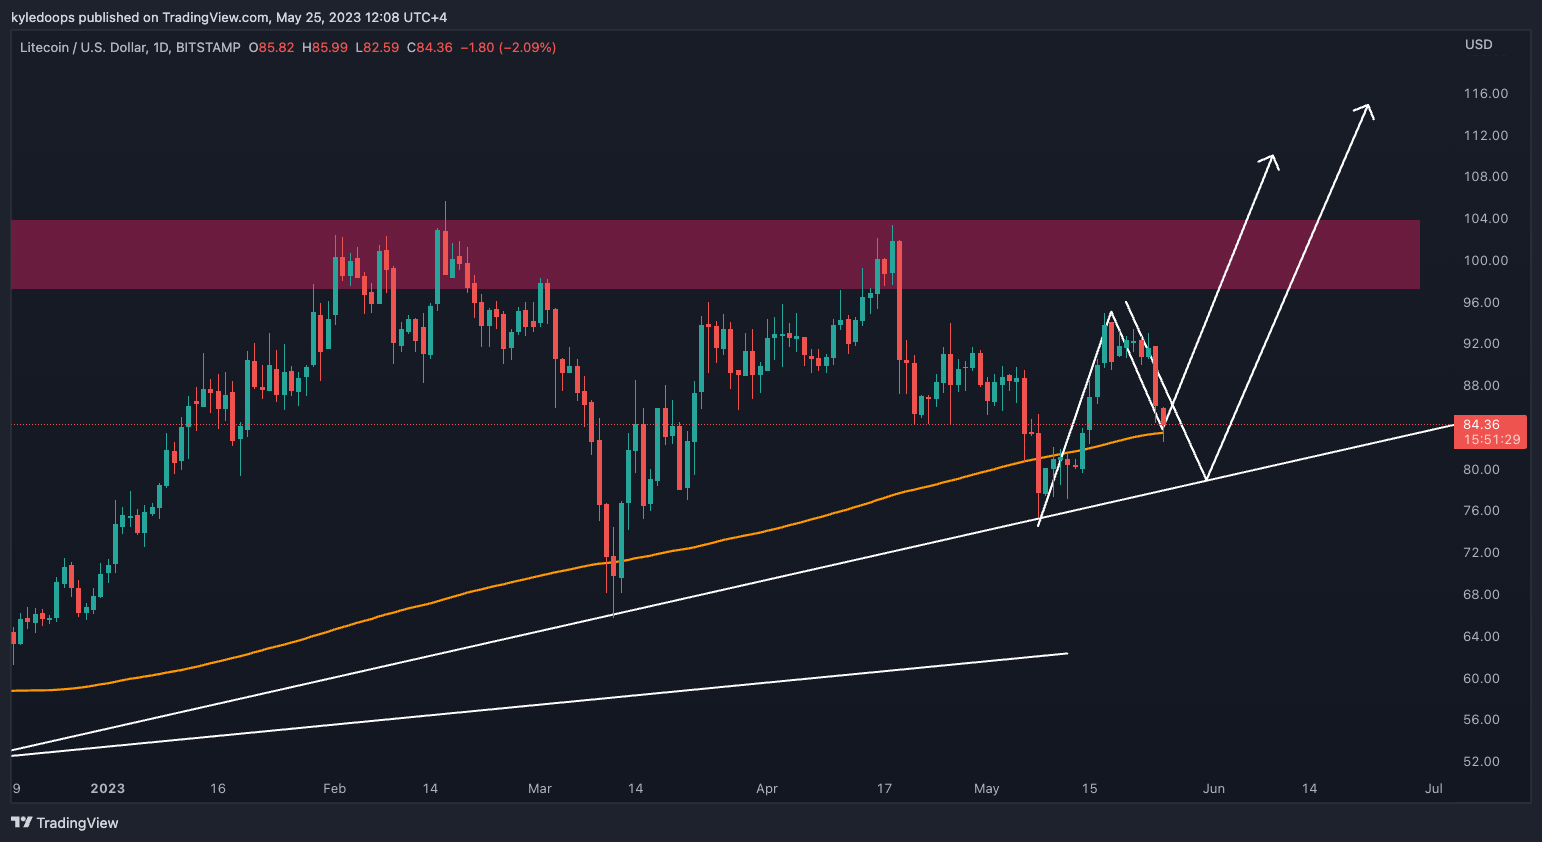
(For the chart screenshot, click here.)
LTC is trying to maintain its 200-day moving average.
As long as it holds the 200-day moving average, there is an opportunity to go long at the next higher low. If it loses the level, we’ll watch for a test of the diagonal trend line and a potential reclaim of the 200-day moving average.
Once that reclaim occurs, it's once again a long opportunity and could be considered a swing failure pattern.
Claim your Bitget sign-up bonuses here (details below).
Chart #4 - Fantom (FTMUSDT) 12-Hour Chart
Chartist: Sheldon

(For the chart screenshot, click here.)
Over the last week, there has been some FUD regarding FTM, which has resulted in the price losing the important $0.36 level of support, now testing the $0.29 - $0.33 support zone.
Price is oversold on the medium time frames, so if FTM can stabilize, it should test resistance at $0.36 next (daily descending resistance line).
Claim your Bitget sign-up bonuses here (details below).
Chart #5 - Bitcoin Fear and Greed Index
The Bitcoin Fear and Greed Index is sitting at 51 today, Neutral.
The highest the index has been over the past seven days is 52, and the lowest is 48.

Banter’s Take
The risk continues to remain on the downside for most crypto, and the dollar is still trending, adding additional downward pressure.
Many coins have come into zones where a short-term bounce could play out, but that short-term bounce does not mean a major reversal.
Stay safe my friends!
Go to our Crypto Banter Discord here where Sheldon and Kyle give updates on the charts and trades from The Daily Candle newsletter!