

📈📉 THIS Altcoin Could 2x Soon!
📈📉 THIS Altcoin Could 2x Soon!
PLUS: NEAR is setting us up for a LONG Trade!
Overview
Chart #1 - USDT Dominance (USDT.D) Weekly
Chart #2 - Bitcoin (BTCUSD) 4-Hour
Chart #3 - Vulcan Forged (PYRUSDT) Daily
Chart #4 - Near (NEARUSDT) Daily
Chart #5 - Fear and Greed Index
Chart #1 - USDT Dominance (USDT.D) Weekly
Chartist: Sheldon
(For the chart screenshot, click here.)
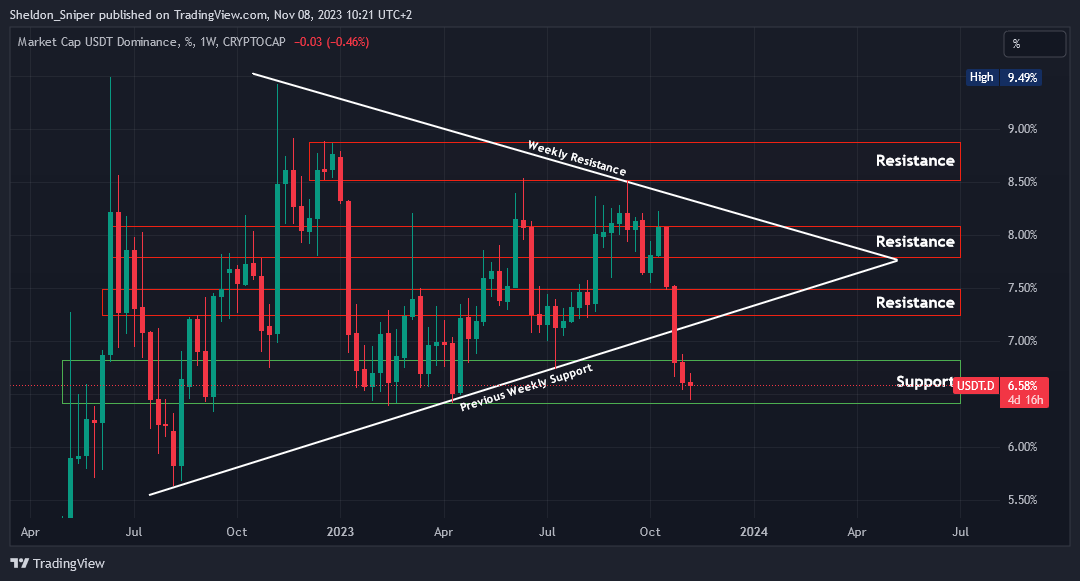
USDT.D is currently in its fourth week of being in a downtrend and has also reached the bottom of the support range at 6.50%.
Over the last year, this area has held as very strong support.
If it bounces again, the first resistance is at the range high of 6.75%.
If the 6.50% level of support does not hold, the next one is at 5.75%, an area last tested in May & August 2022.
Sign-up and trade on Bybit today.
Exclusive $30,000 deposit rewards and bonuses up for grabs!
Chart #2 - Bitcoin (BTCUSD) 4-Hour
Chartist: Kyle
(For the chart screenshot, click here.)
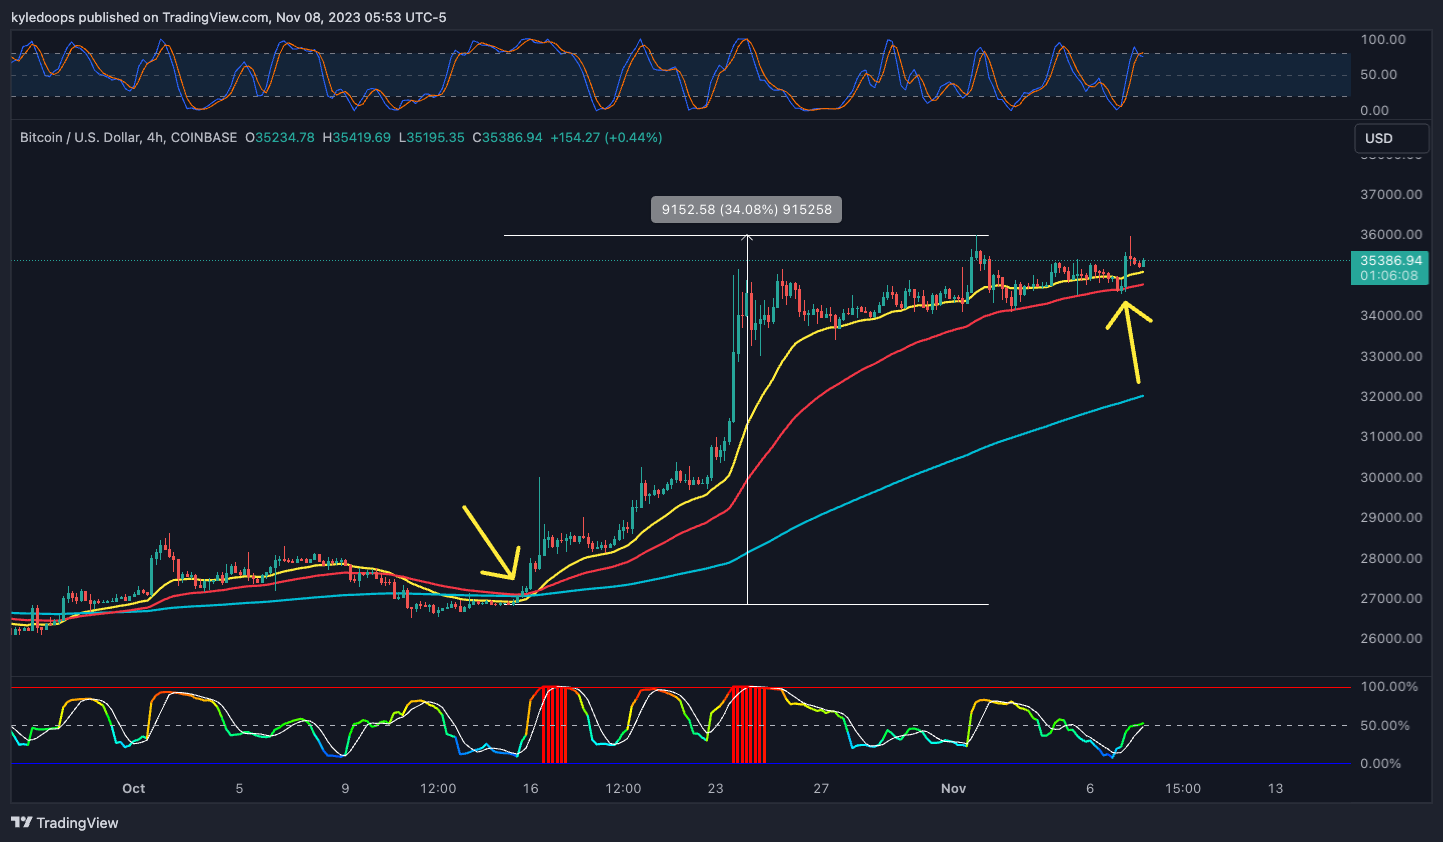
Bitcoin continues to hold its 50 EMA (red line) as support.
Every test of it since the initial impulsive move up from the $25,000 level has held the price up.
If this 50 EMA cross gets lost, then a deeper pullback into the 200 EMA is likely the next major support, which should bounce the price.
Claim your Bitget sign-up bonuses here (details below).

Outsmart 99% Of The Market!
Get full access into our Discord And Telegram group, where you'll find all of our premium content!
👉 Trade Signals!
👉 Trade Set-Ups!
👉 Trading Challenges!
👉 Education!
👉 SO MUCH MORE!
Chart #3 - Vulcan Forged (PYRUSDT) Daily
Chartist: Kyle
(For the chart screenshot, click here.)
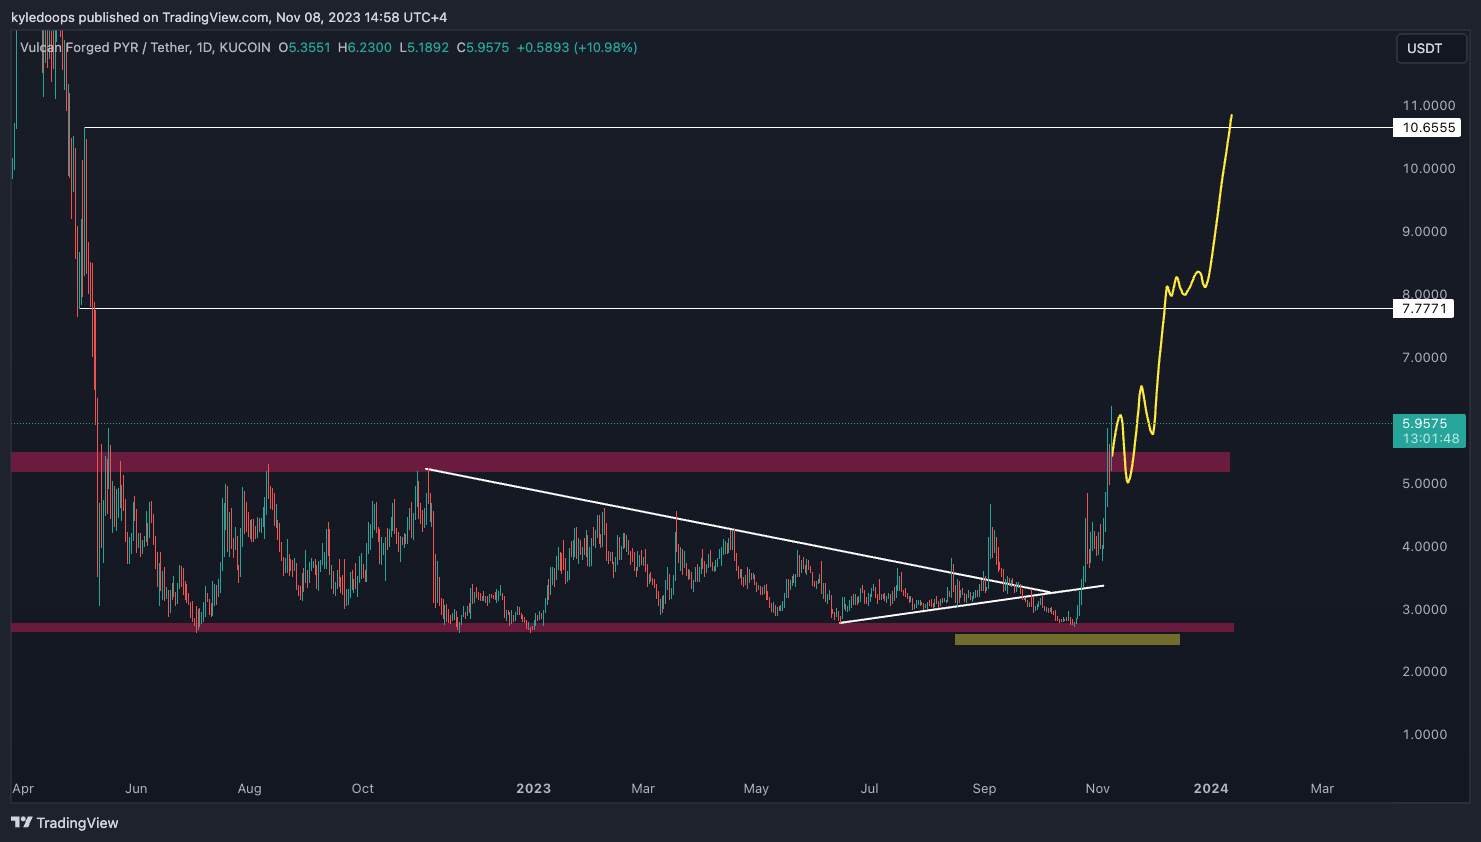
PYR on the daily continues to show signs of strength and has broken out of the range high at $5.50.
If the price holds this $5.50 level, then the next target is $7.77, and after that, we’re looking at $10.65.
Claim your Bitget sign-up bonuses here (details below).
Chart #4 - Near (NEARUSDT) Daily
Chartist: Sheldon
(For the chart screenshot, click here.)
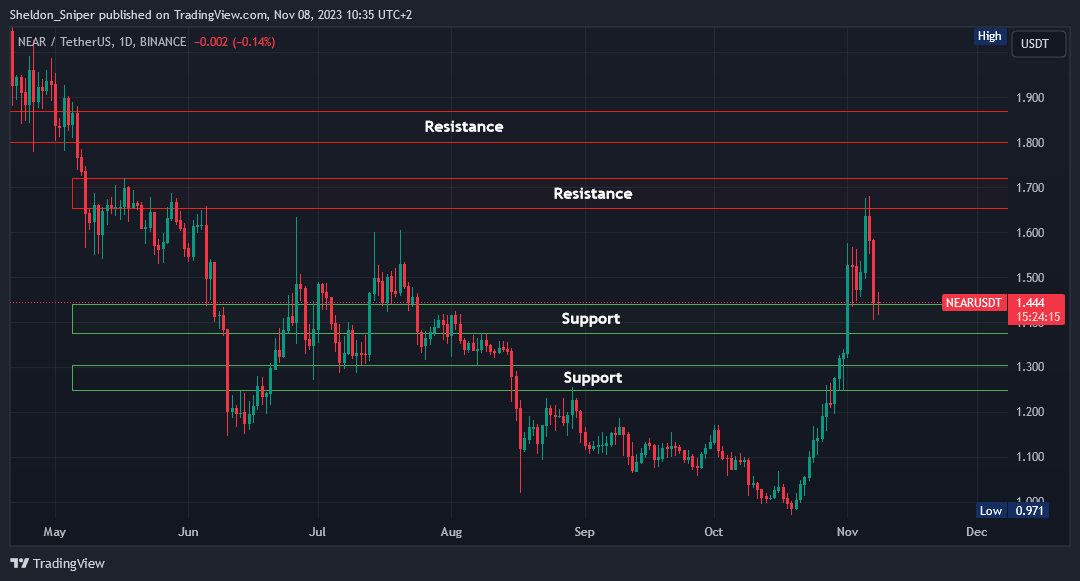
NEAR got rejected at $1.66 earlier in the week
It has now retraced down to the $1.37 - $1.44 area of support. If it holds, it could set up a long trade, for the price to once again test the $1.65 - $1.72 area of resistance, or even test the next area of resistance at $1.80 - $1.87.
If the market retraces from here, and NEAR loses the $1.37 level of support, it could visit $1.25 - $1.30.
NEAR has made a massive 65% move over the last three weeks, and a retrace to test lower areas of support would be healthy.
Claim your Bitget sign-up bonuses here (details below).
🚀 Sniper School's New Cohort Begins November 7th!
Sniper School is a free 3-week trading course led by Sheldon. Dive deep into his strategies and insights to master the art of trading. Equip yourself with the skills to capitalize on market shifts and maximize your gains.
Limited Seats! With only 3,000 seats available, our waitlist fills up rapidly! Secure Your Seat Today!
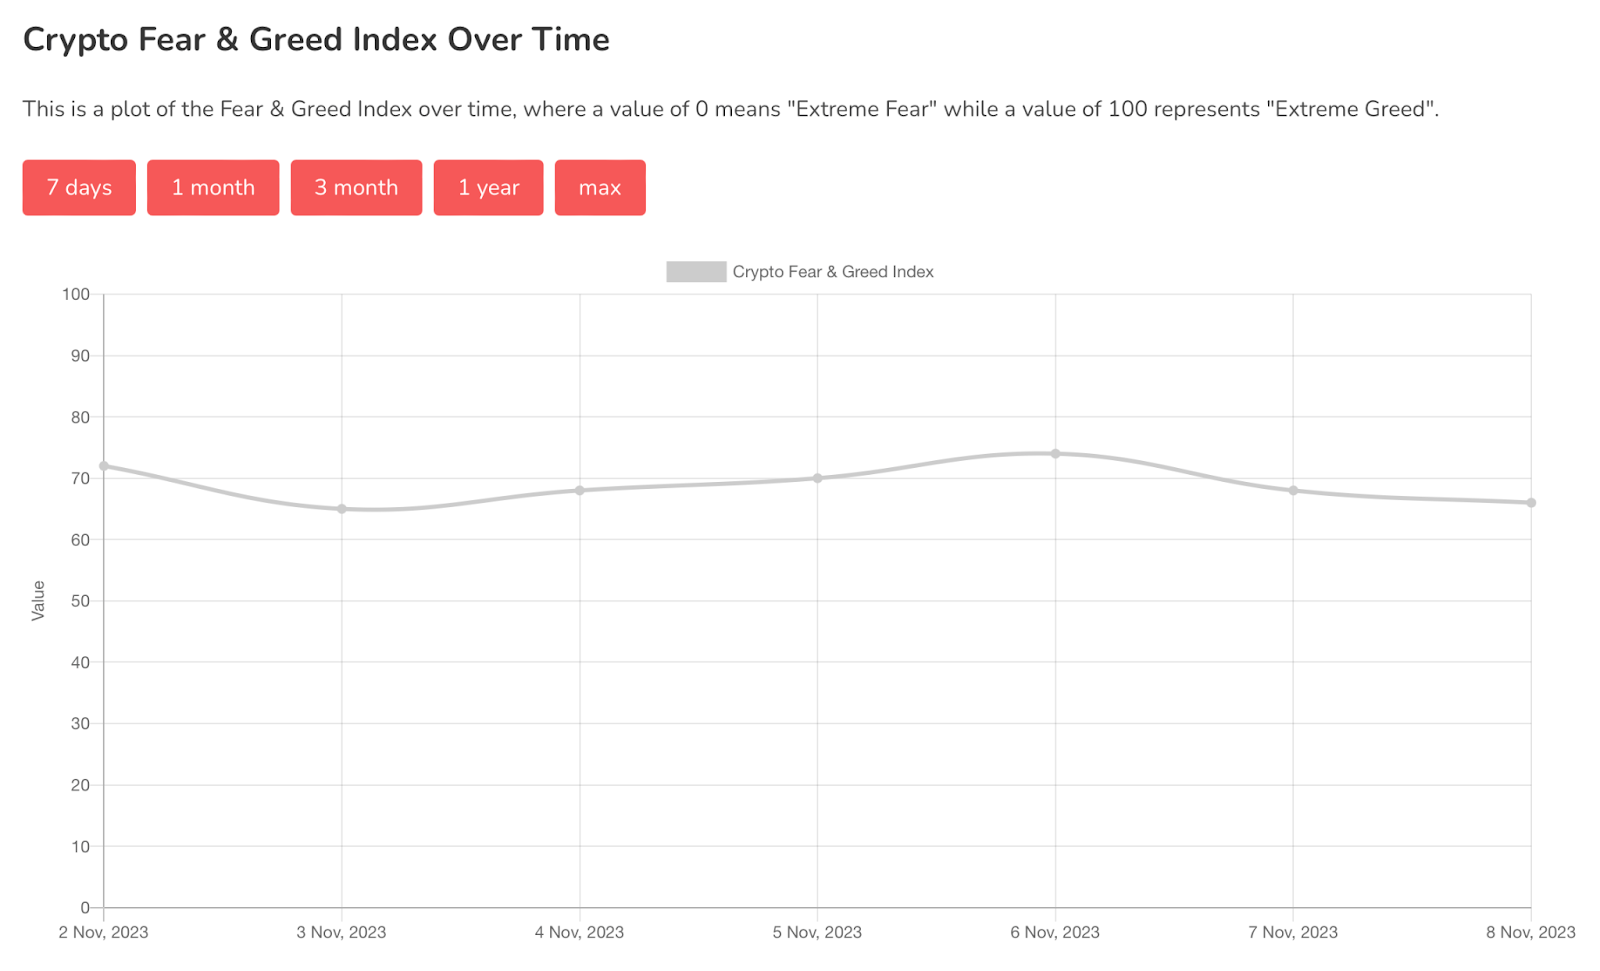
Chart #5 - Fear and Greed Index
The Fear and Greed Index is sitting at 66 today, indicating Greed.
The highest the index has been over the past seven days is 72, and the lowest is 65.
Banter’s Take
Don't fade the trend; a strong uptrend is in play, and people are rotating into other coins, which is why we're seeing these altcoins rally.
Stay safe my friends!
Go to our Crypto Banter Discord here where Sheldon and Kyle give updates on the charts and trades from The Daily Candle newsletter!
I'm in the US. I tried to sign up for Sniper School but it directed me to MEXC which doesn't allow US citizens. How do US folks sign up?