

📈📉 THIS Altcoin Could DOUBLE SOON! +100% Gains!
📈📉 THIS Altcoin Could DOUBLE SOON! +100% Gains!
PLUS: Bitcoin Faces Significant Sell Walls At $49,000 And $50,000!
Overview
Chart #1 - Bitcoin (BTCUSDT) 12-Hour
Chart #2 - Decimated (DIOUSDT) 12-Hour
Chart #3 - Magic (MAGICUSDT) 12-Hour
Chart #4 - Polkadot (DOTUSDT) 12-Hour
Chart #5 - Fear and Greed Index
Chart #1 - Bitcoin (BTCUSDT) 12-Hour
Chartist: Sheldon
(For the chart screenshot, click here.)
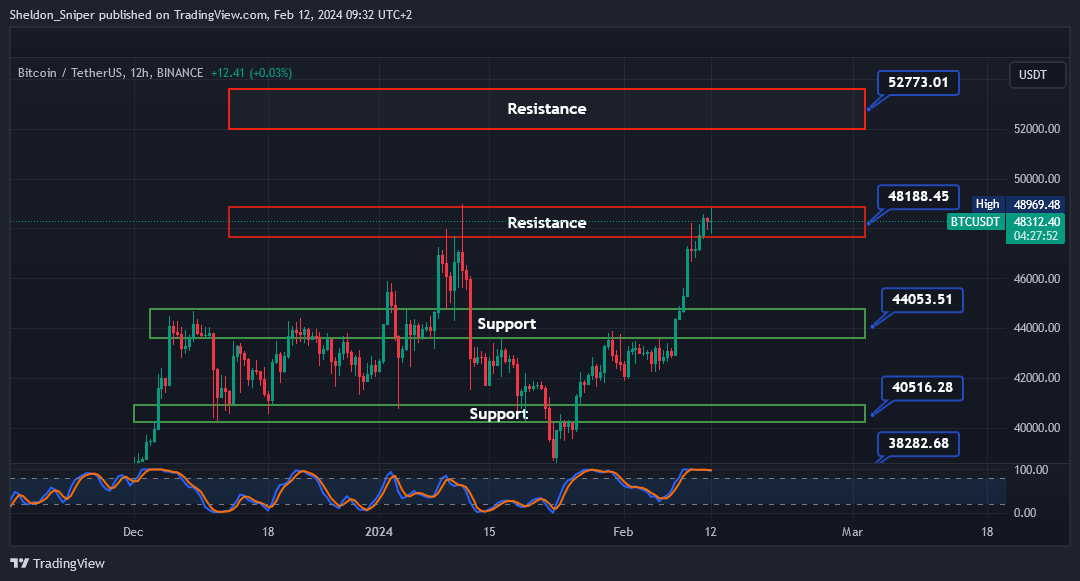
In the past week, BTC has surged from $43,500 to $48,000, testing the $48,000 - $49,000 resistance area.
It has shown strength compared to the alts, as seen by the increase in BTC Dominance.
Now, if the $49,000 level is breached, BTC could head to $52,000 - $53,500. On the other hand, if it’s rejected, the next support zone is at $43,800 - $44,500.
Sign-up and trade on Bybit today.
Exclusive $30,000 deposit rewards and bonuses up for grabs!
Chart #2 - Decimated (DIOUSDT) 12-Hour
Chartist: Kyle
(For the chart screenshot, click here.)
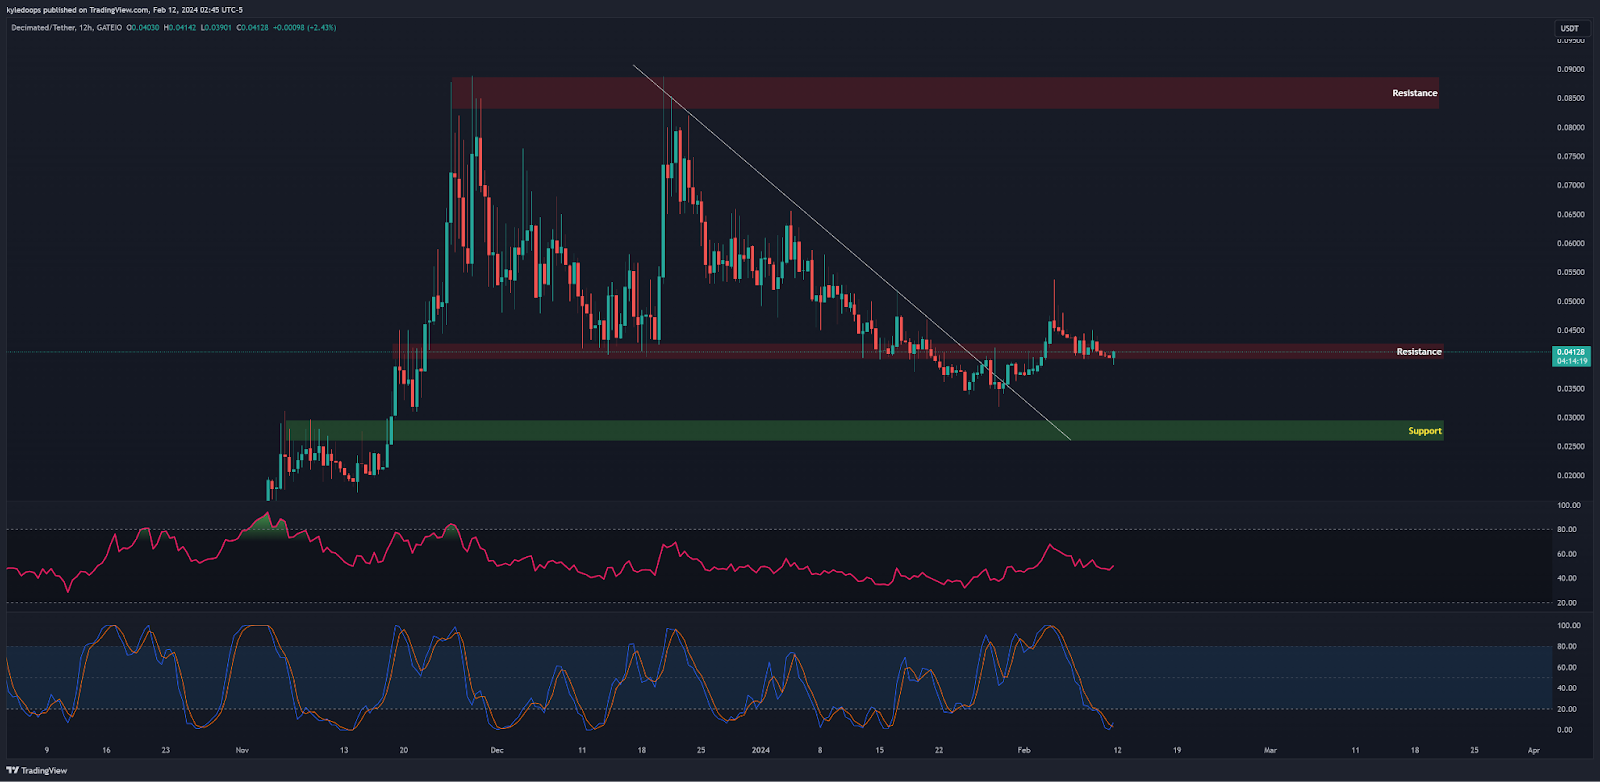
DIO seems to have turned the resistance into support, with indicators pointing to a continuation from here.
Entering from here seems solid. The next target is at $0.084. That’s a 100% move.
However, if Bitcoin retraces to lower levels, there is a chance DIO targets $0.03, a 30% dip.
Claim your Bitget sign-up bonuses here (details below).

Outsmart 99% Of The Market!
Get full access into our Discord And Telegram group, where you'll find all of our premium content!
👉 Trade Signals!
👉 Trade Set-Ups!
👉 Trading Challenges!
👉 Education!
👉 SO MUCH MORE!
Chart #3 - Magic (MAGICUSDT) 12-Hour
Chartist: Kyle
(For the chart screenshot, click here.)
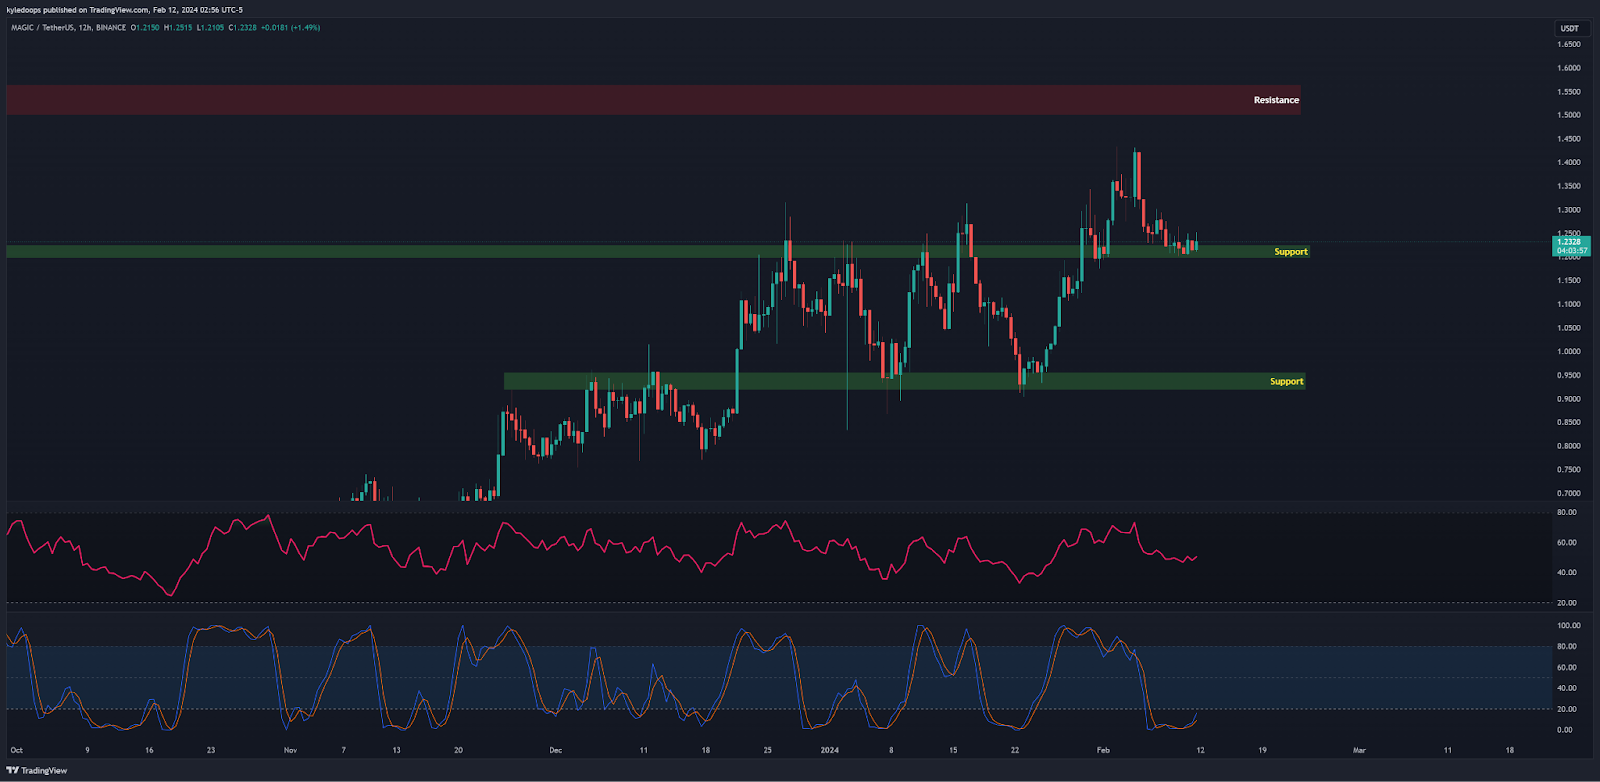
MAGIC, on the 12-hour timeframe, is currently priced at $1.24.
It appears to have retraced to a previous support area and is waiting for a potential move higher.
The next resistance is at $1.50. The Stochastic RSI is printing a reversal, as is the RSI.
All in all I don’t think it’s moving lower any time soon!
Claim your Bitget sign-up bonuses here (details below).
Chart #4 - Polkadot (DOTUSDT) 12-Hour
Chartist: Sheldon
(For the chart screenshot, click here.)
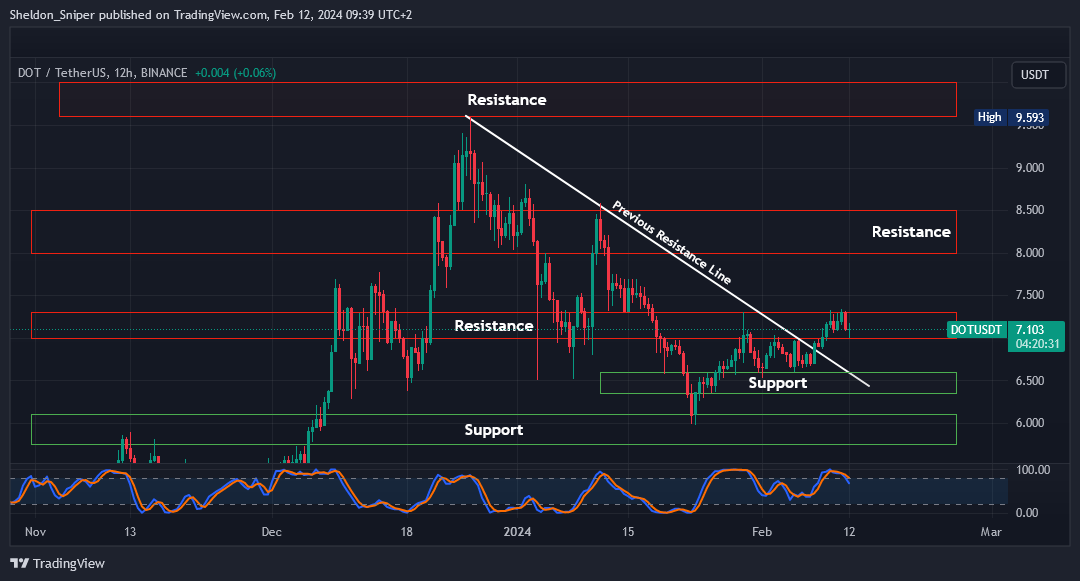
DOT is at $7.10. The price may consolidate within the current resistance zone of $7.00 - $7.30.
However, should it retrace further to the next support level at approximately $6.60, it would present an opportunity to enter a long spot trade. The strategy would be to take profits at the following resistance levels:
$8.00 - $8.50
$9.60 - $10.00.
I plan to set my stop loss at around $6.25.
Claim your Bitget sign-up bonuses here (details below).
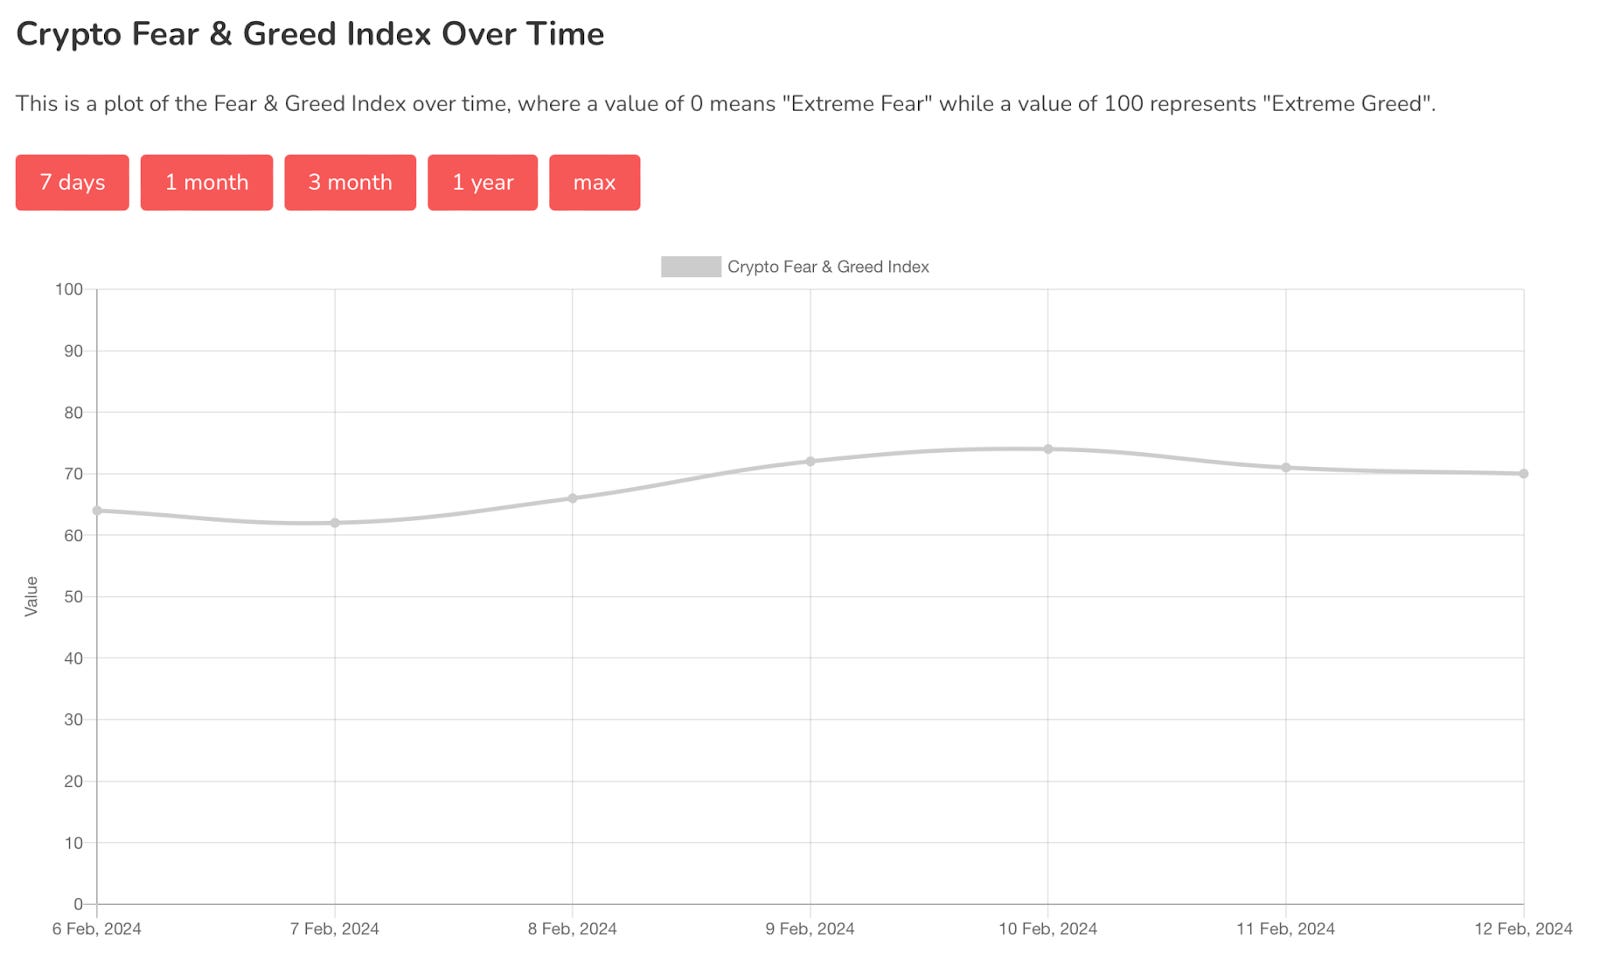
Chart #5 - Fear and Greed Index
The Fear and Greed Index is sitting at 70 today, indicating Greed.
The highest the index has been over the past seven days is 74, and the lowest is 62.
Banter’s Take
Today's weekly open, along with the Asian and European markets, has not provided a clear direction despite a strong bullish close last week.
We'll need to wait and see what the US session brings later today. Bitcoin faces significant sell walls at $49,000 and $50,000, which are worth monitoring to see how the market reacts. For now, there's no immediate rush to enter into trades.
Stay safe my friends!
Go to our Crypto Banter Discord here where Sheldon and Kyle give updates on the charts and trades from The Daily Candle newsletter!