

📈📉 This BTC Trade Keeps Paying BIG Bucks!
📈📉 This BTC Trade Keeps Paying BIG Bucks!

Overview
Chart #1 - Ethereum (ETHUSDT) Daily Chart
Chart #2 - Bitcoin (BTCUSD) Hourly Chart
Chart #3 - Crypto Total Market Cap Excluding Bitcoin (TOTAL2) 3-Day Chart
Chart #4 - USDT Dominance (USDT.D) 3-Day Chart
Chart #5 - Fear and Greed Index

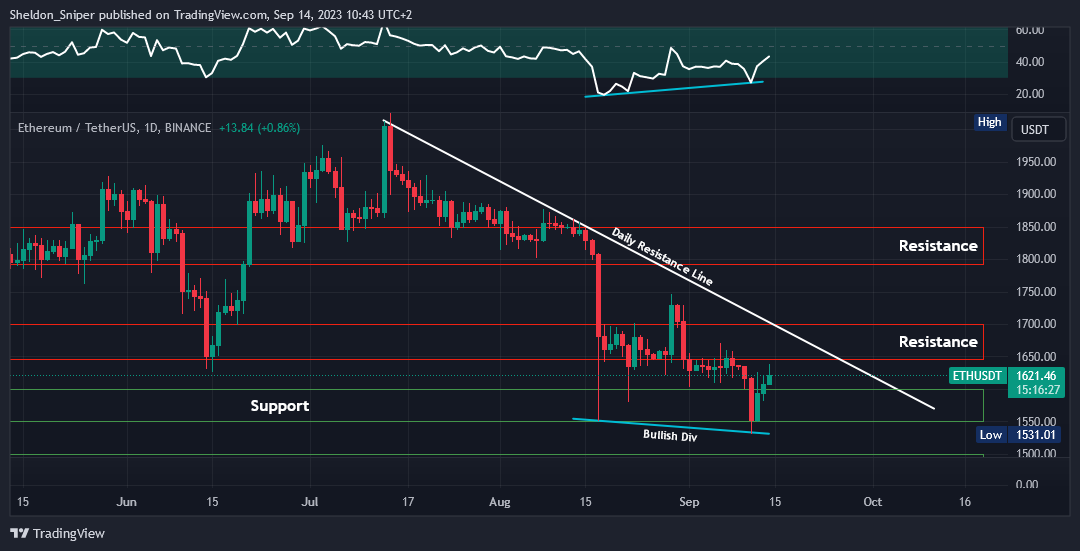
Chart #1 - Ethereum (ETHUSDT) Daily Chart
Chartist: Sheldon
(For the chart screenshot, click here.)
After capturing liquidity at the $1,531 level on Monday, ETH price reversed to the upside.
It has now reclaimed the $1,550 - $1,600 support level and appears ready to test the next resistance level at $1,650 - $1,700. It also displayed a bullish divergence, where the RSI on the daily time frame was higher compared to the 17th of August, even though the price was lower on the same date.
ETH is currently trading at $1,620, positioned roughly midway between the $1,600 support level and the $1,650 resistance level. If it continues to ascend and breaks through the $1,650 resistance, it could rise as high as $1,700.
𝗣𝗿𝗶𝗺𝗲 𝗫𝗕𝗧
Sign up for a new Trading Account on Prime XBT!
Receive a deposit bonus of up to $7,000 with promo code: SheldonSniper
Sign-up and trade on Bybit today.
Exclusive $30,000 deposit rewards and bonuses up for grabs!
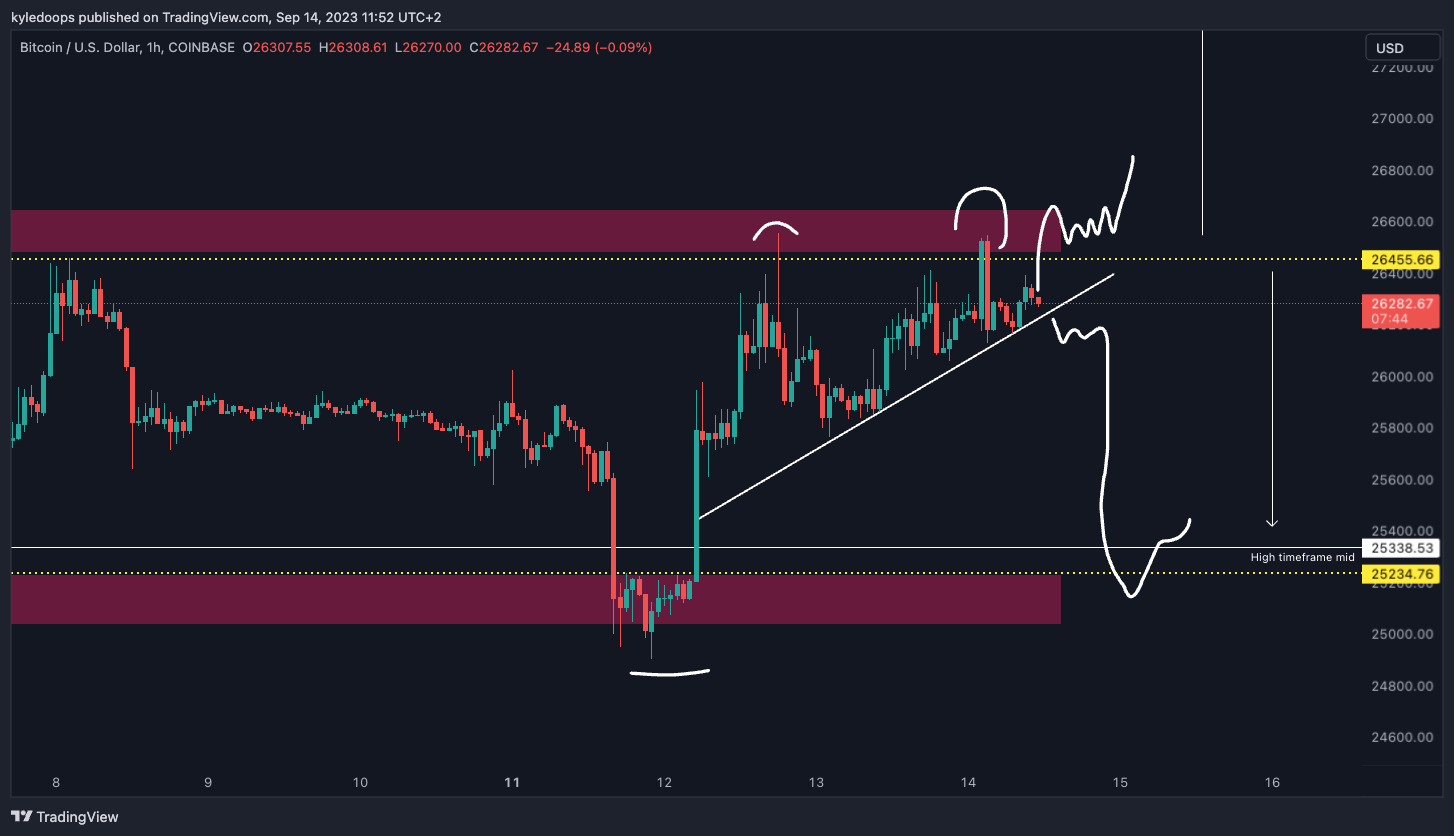
Chart #2 - Bitcoin (BTCUSD) Hourly Chart
Chartist: Kyle
(For the chart screenshot, click here.)
Same range, same trade that keeps paying big bucks!
We’ll go long above $26,500 if it consolidates and holds that level. And short on the sweep above $26,500 once it's back inside the range.
We’ll continue to rinse and repeat the trade between those two levels until it convincingly leaves the range.
𝗣𝗿𝗶𝗺𝗲 𝗫𝗕𝗧
Sign up for a new Trading Account on Prime XBT!
Receive a deposit bonus of up to $7,000 with promo code: KyleDoops
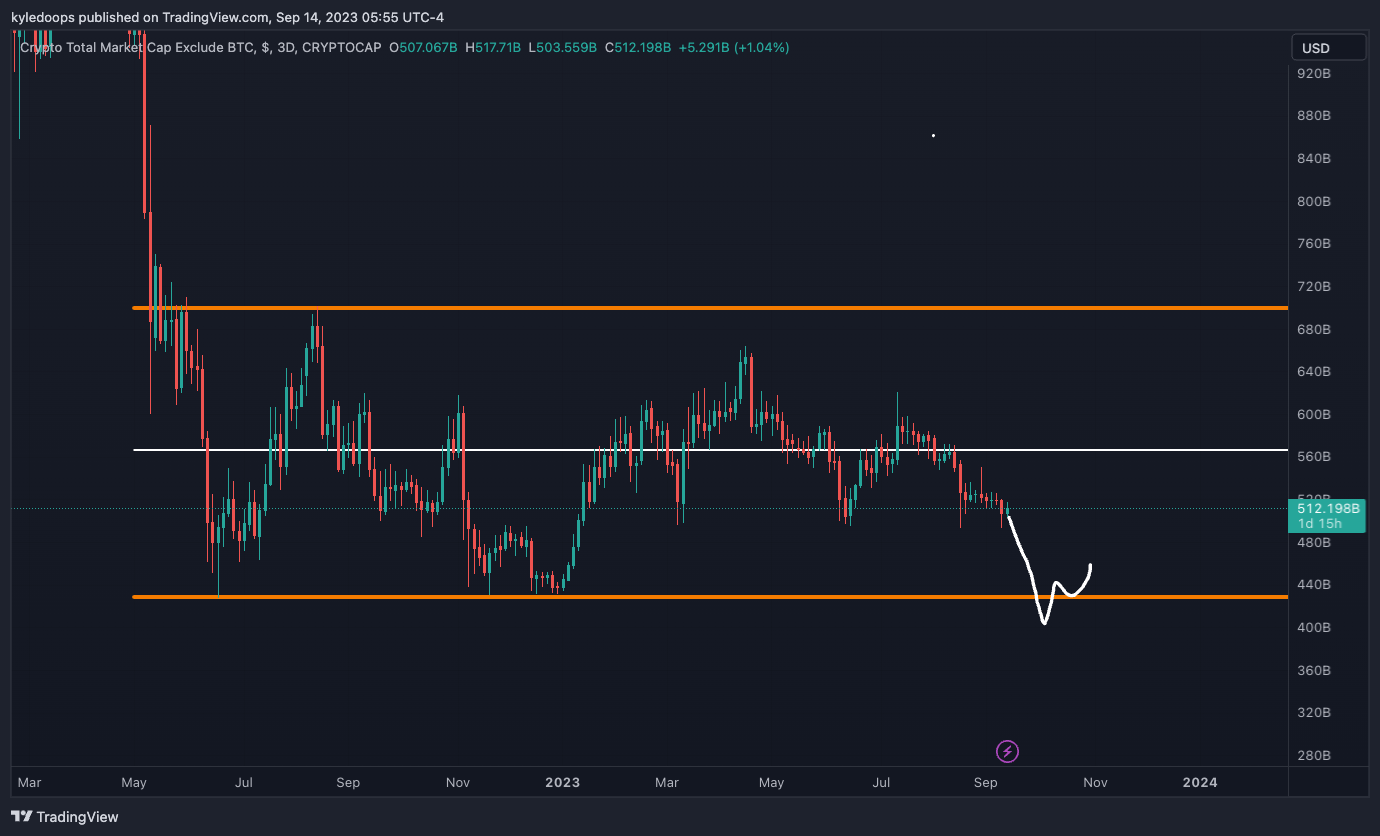
Chart #3 - Crypto Total Market Cap Excluding Bitcoin (TOTAL2) 3-Day Chart
Chartist: Kyle
(For the chart screenshot, click here.)
There’s a high probability that the TOTAL2 heads towards the range lows at $440B.
Invalidation would be if it rises above $570 Billion, at which time the mid-range level is reclaimed.
Claim your Bitget sign-up bonuses here (details below).
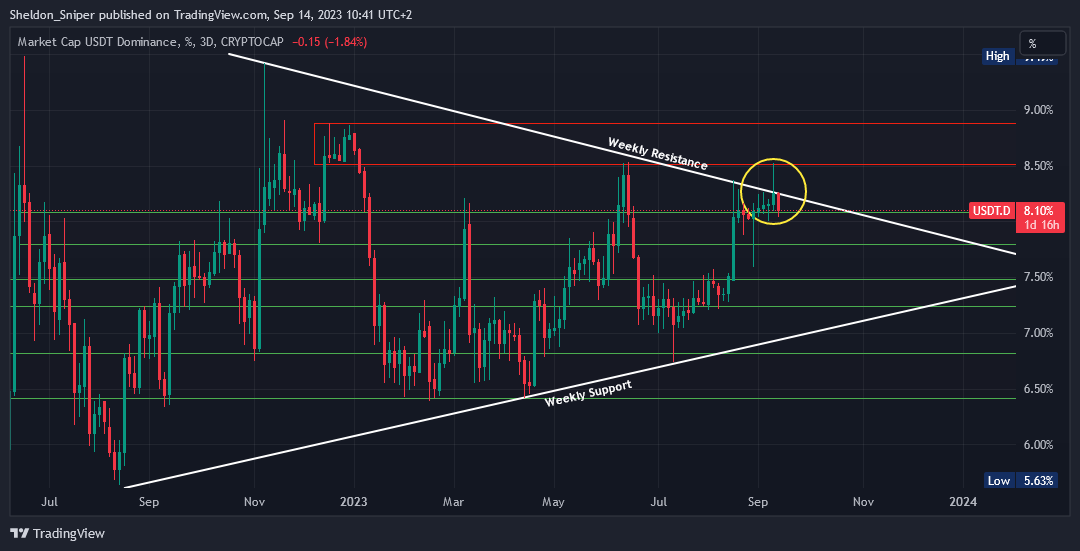
Chart #4 - USDT Dominance (USDT.D) 3-Day Chart
Chartist: Sheldon
(For the chart screenshot, click here.)
Over the past 12 months, USDT Dominance has formed a massive bullish pennant!
It has trended between a weekly ascending support line, creating higher lows, and a weekly descending resistance line, which has resulted in lower highs.
Earlier this week, it attempted to break out of the structure at 8.20%, reaching the first resistance at 8.5% before getting rejected. It then re-entered the structure and found support at the 8.10% level. The 8.10% level has acted as support over the last four weeks. If this support is lost, the next support stands at 7.75%.
Claim your Bitget sign-up bonuses here (details below).
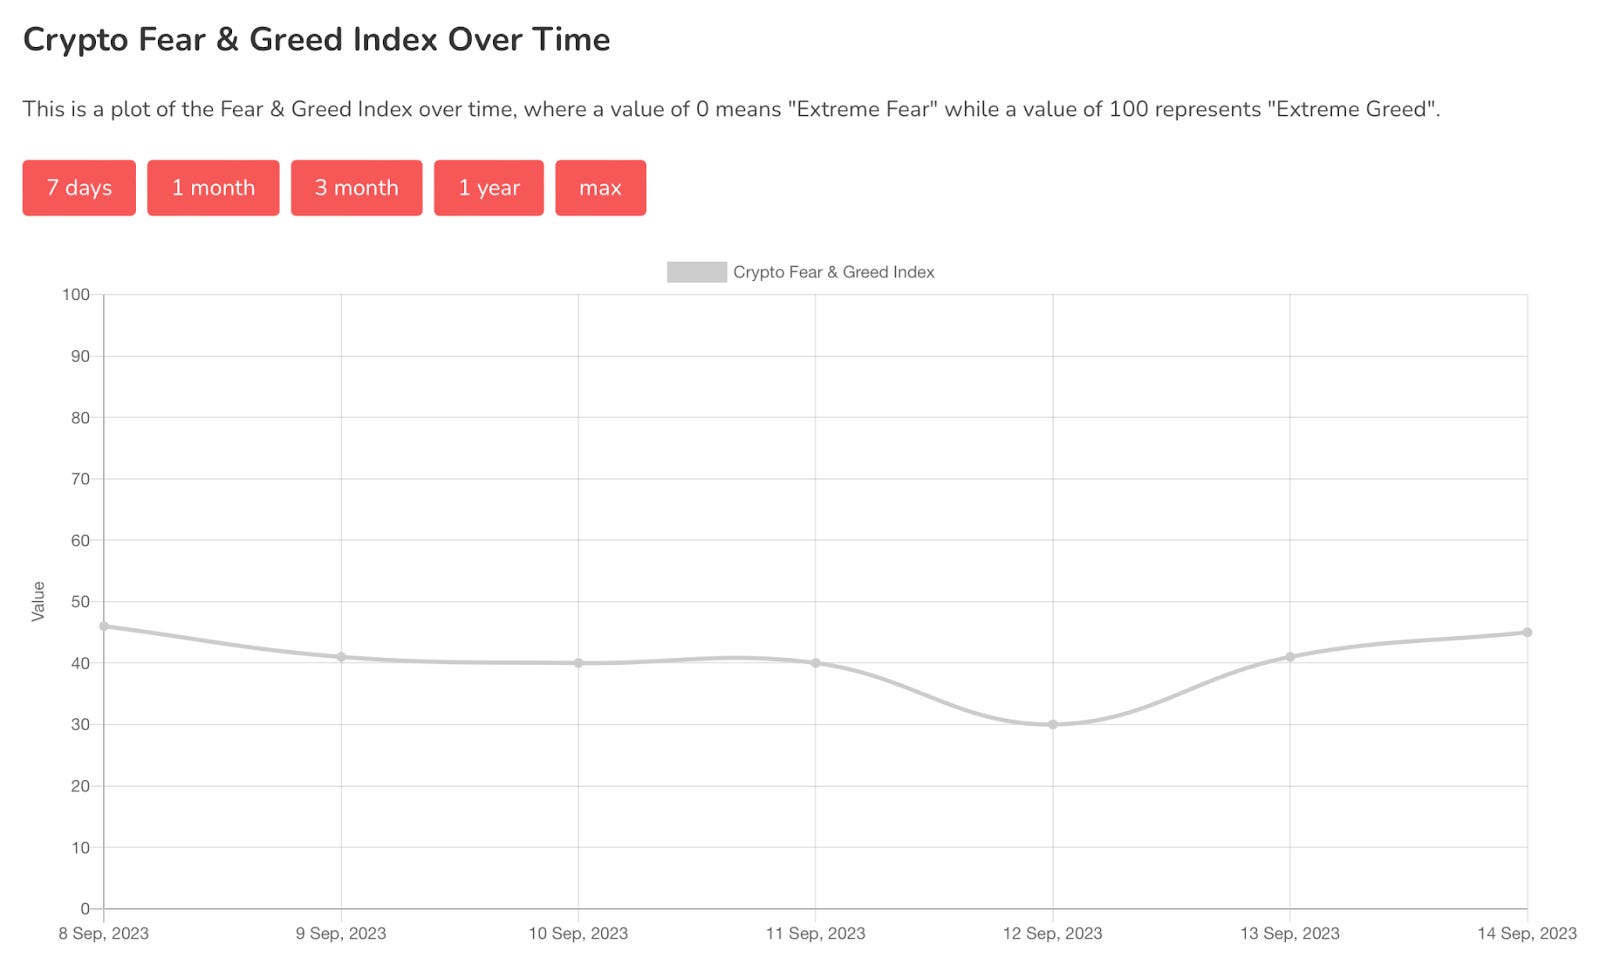
Chart #5 - Fear and Greed Index
The Fear and Greed Index is sitting at 45 today, indicating Fear.
The highest the index has been over the past seven days is 46, and the lowest is 30.
Banter’s Take
Major options expirations in the stock market are imminent, and PPI results are due today. Once these economic events have passed, we should see a clearer market direction. Currently, the market is experiencing continued choppiness and consolidation, which is conducive to low timeframe range trading but detrimental for trend trading.
Stay safe my friends!
Go to our Crypto Banter Discord here where Sheldon and Kyle give updates on the charts and trades from The Daily Candle newsletter!