

📈📉 This could send bitcoin to $33k! Altcoins are pumping!
📈📉 This could send bitcoin to $33k! Altcoins are pumping!

Bitget winner - 5314470526
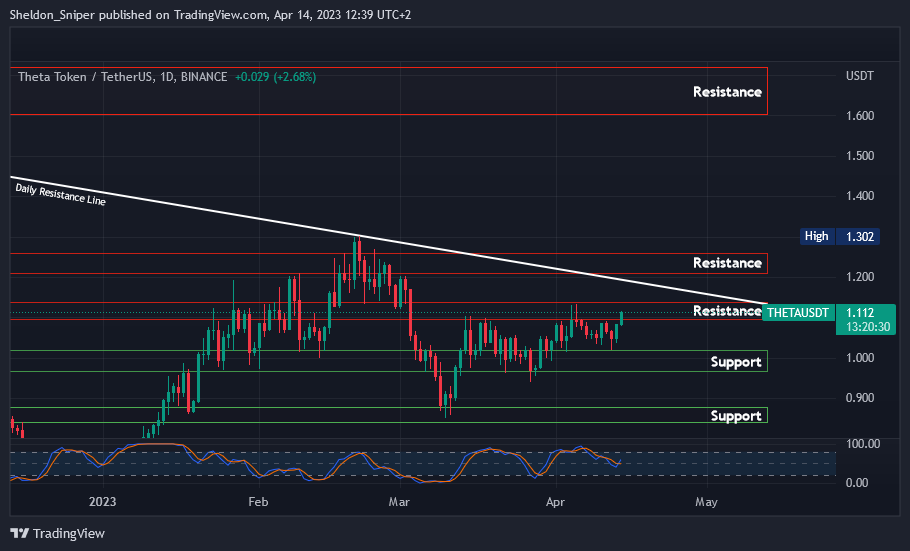
Chart #1 - Theta Network (THETAUSDT) 1-Day Chart
Chartist: Sheldon
(For the chart screenshot, click here.)
If THETA can break $1.10 - $1.12 (resistance), there is a chance it heads to $1.15, or possibly even pushes through to the next resistance at $1.20 (resistance line from August).
Since alts seem to be pumping, if it pushes through there, it could rally all the way up to the next major resistance at $1.60 - $1.70.
If the rally comes to an end sooner than later, and THETA drops, it will likely head to $1.00.
𝗣𝗿𝗶𝗺𝗲 𝗫𝗕𝗧
Sign up for a new Trading Account on Prime XBT!
Receive a deposit bonus of up to $7,000 with promo code: SheldonSniper
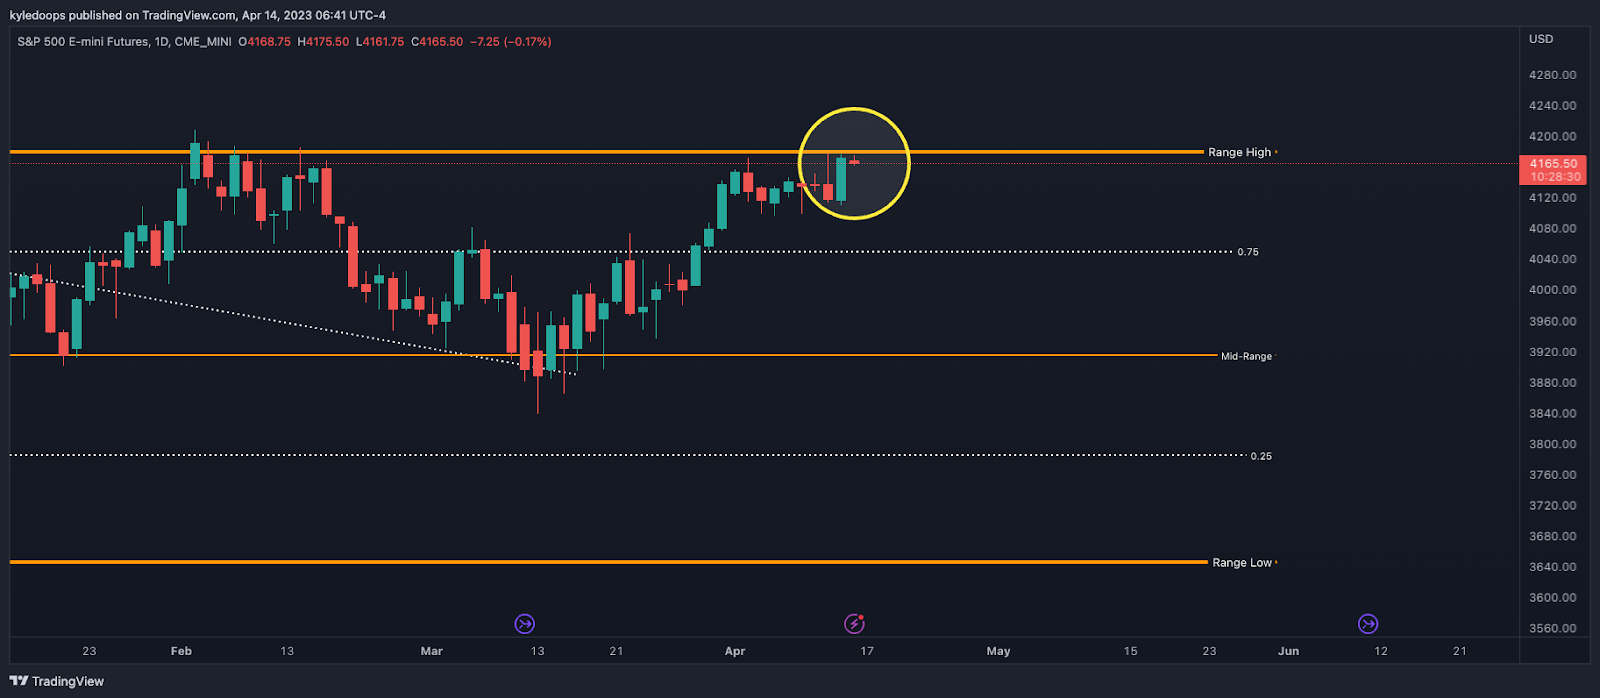
Chart #2 - S&P 500 1-Day Chart
Chartist: Kyle
(For the chart screenshot, click here.)
The S&P 500 is a large driver of markets in general and consequently, something to watch since it's at a range high extremity.
I expect either a rejection off of its range high or a break above it.
But what's more important is the fact that the VIX (see below) is contracting to extremely low levels, while the S&P 500 is hitting resistance.
𝗣𝗿𝗶𝗺𝗲 𝗫𝗕𝗧
Sign up for a new Trading Account on Prime XBT!
Receive a deposit bonus of up to $7,000 with promo code: KyleDoops

Chart #3 - VIX 1-Day Chart
Chartist: Kyle

(For the chart screenshot, click here.)
The last time the VIX came this low, it brought with it a great stock market top.
The VIX must be used in context with the S&P 500. When the S&P 500 is at extremities while the VIX is at historical lows is when we need to pay attention.
A tick-up from here would likely result in a rejection. But if you see it continuing to contract while the S&P 500 breaks its key level to the upside, it would be a good thing and mean the breakout could continue.
Claim your Bitget sign-up bonuses here (details below).
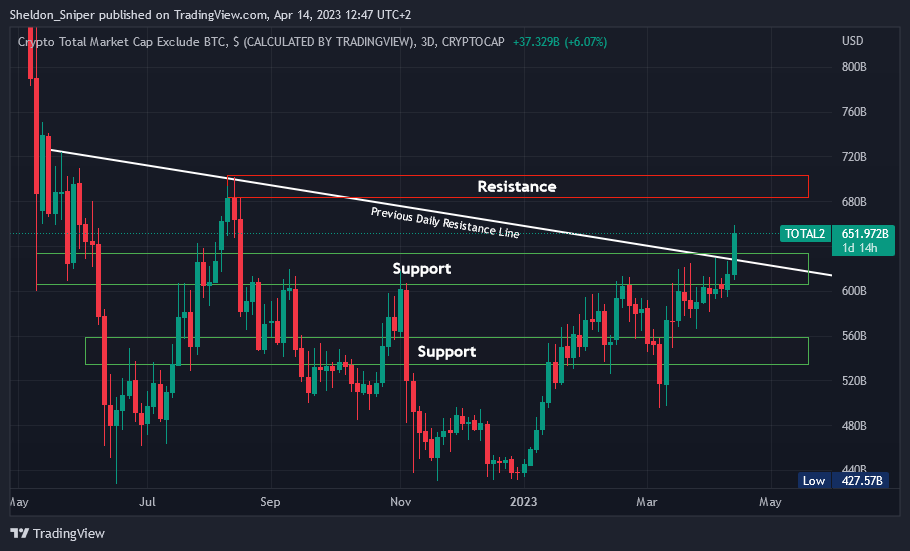
Chart #4 - TOTAL2 3-Day Chart
Chartist: Sheldon
(For the chart screenshot, click here.)
This week we saw a significant move in the TOTAL2, as it broke its daily resistance line (from June).
The chart is clearly showing that cash is now flowing into the alts.
It started the week at $600B and has moved up to $650B. There could be a further push up to test the next resistance area at $680B, but I expect that in the next few days there will be a retest of $630B. A positive retest could set the TOTAL2 up to test higher levels, potentially sparking a much-anticipated alt season.
Claim your Bitget sign-up bonuses here (details below).
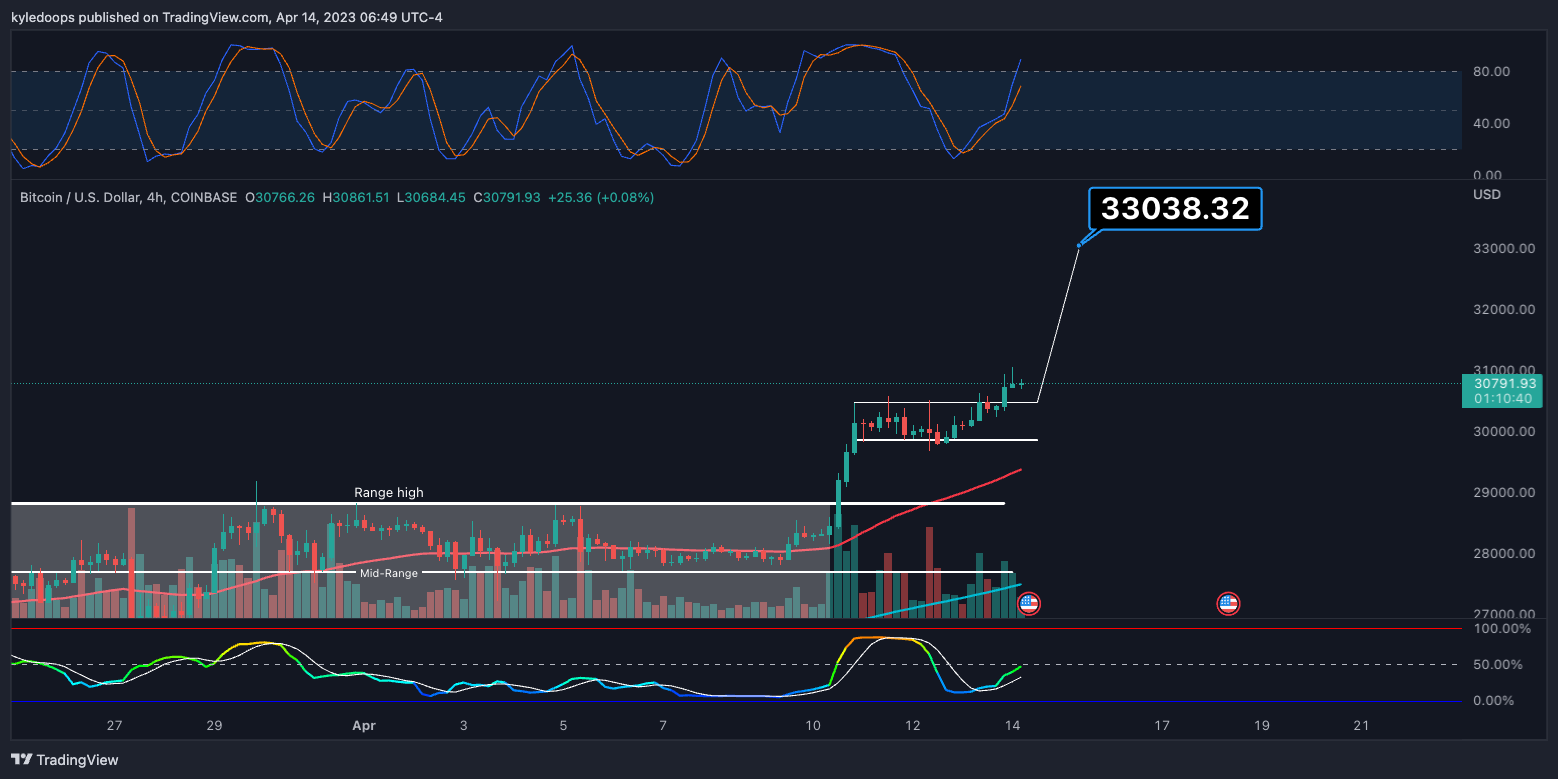
Chart #5 - Bitcoin (BTCUSD) 4-Hour Chart
Chartist: Kyle
(For the chart screenshot, click here.)
Bitcoin is currently attempting to break out of another smaller bull flag.
If the pattern plays out, the measured move will take it up to $33,000.
The pivot level is $30,253. So long as bitcoin holds that level, pressure continues to remain towards the upside.
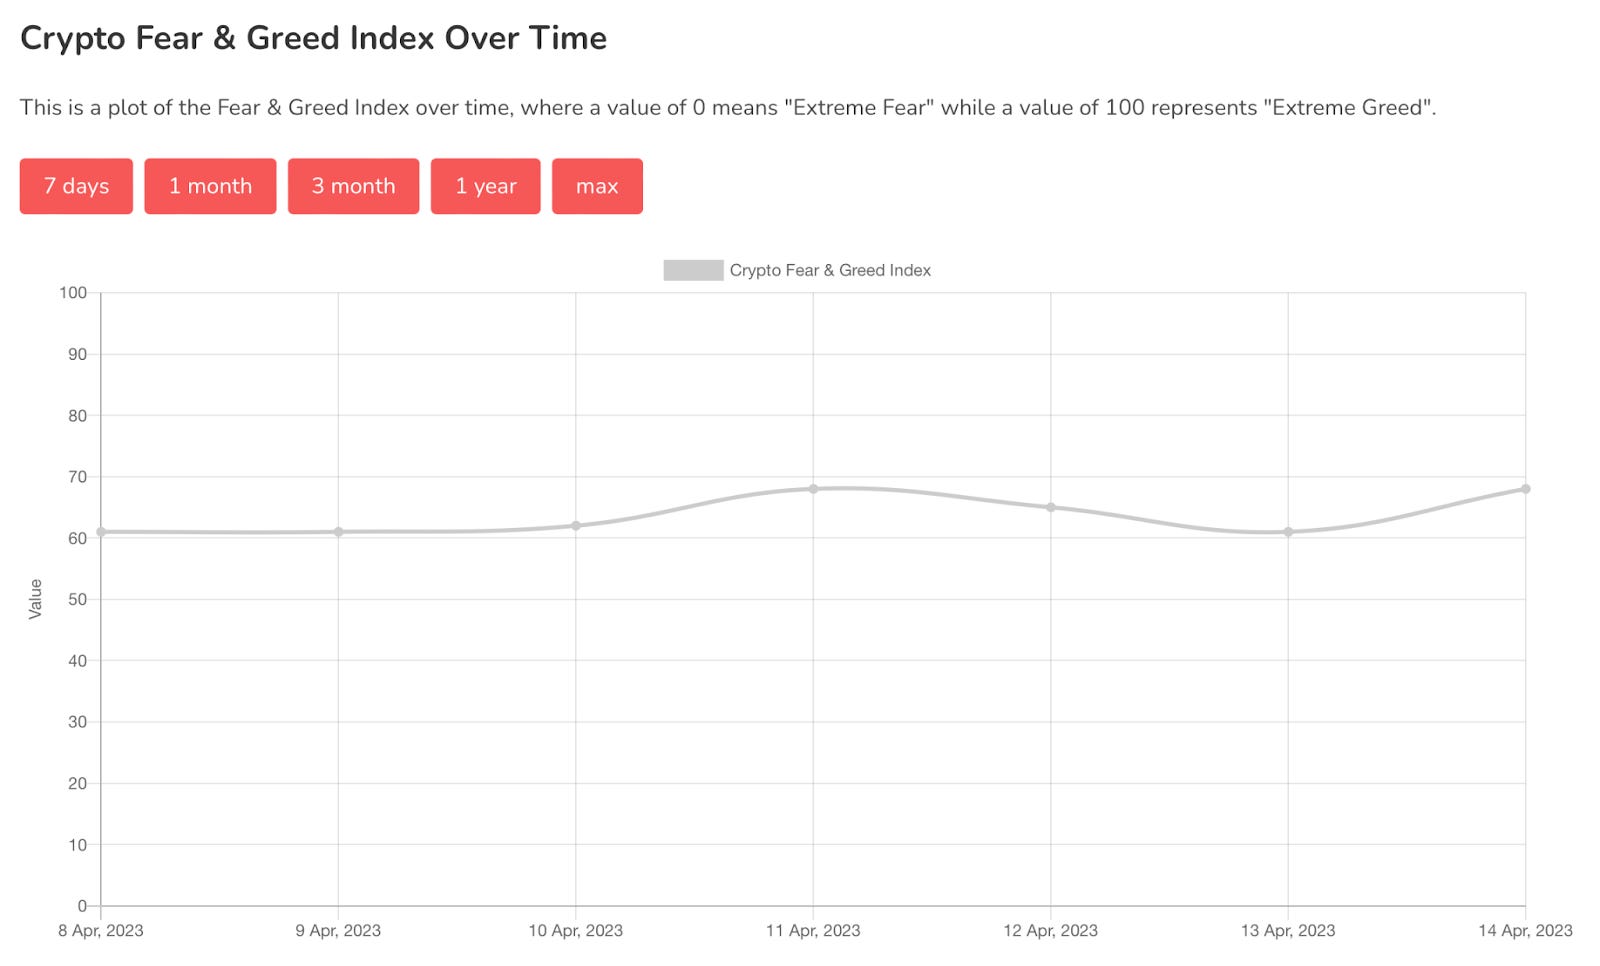
Chart #6 - Bitcoin Fear and Greed Index
The Bitcoin Fear and Greed Index is sitting at 68 today, indicating Greed.
The highest the index has been over the past seven days is 68, and the lowest is 61.
Overall Market Sentiment (Banter’s Take)
The market sentiment is only just starting to switch from greed to full-on FOMO. FOMO is not the environment we want to establish large fresh new spot positions, as we would be closer to the end of the move than to the start of it.
Short-lived long trades are fine, otherwise, it's preferable to wait for a deeper pullback on missed pumps.
Stay safe my friends!
Go to our Crypto Banter Discord here where Sheldon and Kyle give updates on the charts and trades from The Daily Candle newsletter!
Bybit winner - 7705273