

📈📉 THIS is How Bitcoin Reaches $32K!
📈📉 THIS is How Bitcoin Reaches $32K!

Overview
Chart #1 - Near (NEARUSDT) 8-Hour
Chart #2 - Ethereum to Bitcoin Ratio (ETHBTC) Daily
Chart #3 - Bitcoin (BTCUSD) Daily
Chart #4 - Bitcoin Dominance (BTC.D) 12-Hour
Chart #5 - Fear and Greed Index

Chart #1 - Near (NEARUSDT) 8-Hour
Chartist: Sheldon

(For the chart screenshot, click here.)
Last night NEAR broke above a major resistance line that dates back to mid-July, at around $1.12.
It is currently trading at $1.13 and will most likely retest the breakout before heading to the next area of resistance at around $1.19 - $1.21.
If last night's move ends up being a fakeout, and price continues to the downside, the next level of support is at around $1.10.
Sign-up and trade on Bybit today.
Exclusive $30,000 deposit rewards and bonuses up for grabs!
Chart #2 - Ethereum to Bitcoin Ratio (ETHBTC) Daily
Chartist: Kyle

(For the chart screenshot, click here.)
ETH is weak against BTC, and ETH/BTC is likely to head down to the 0.05578922 level.
It could easily push through that level, so wait for the reaction. If there is a reaction at that level and it bounces, then it could be a long opportunity on ETH vs BTC.
But for now, risk is down for ETH against BTC.
𝗣𝗿𝗶𝗺𝗲 𝗫𝗕𝗧
Sign up for a new Trading Account on Prime XBT!
Receive a deposit bonus of up to $7,000 with promo code: KyleDoops
Chart #3 - Bitcoin (BTCUSD) Daily
Chartist: Kyle
(For the chart screenshot, click here.)
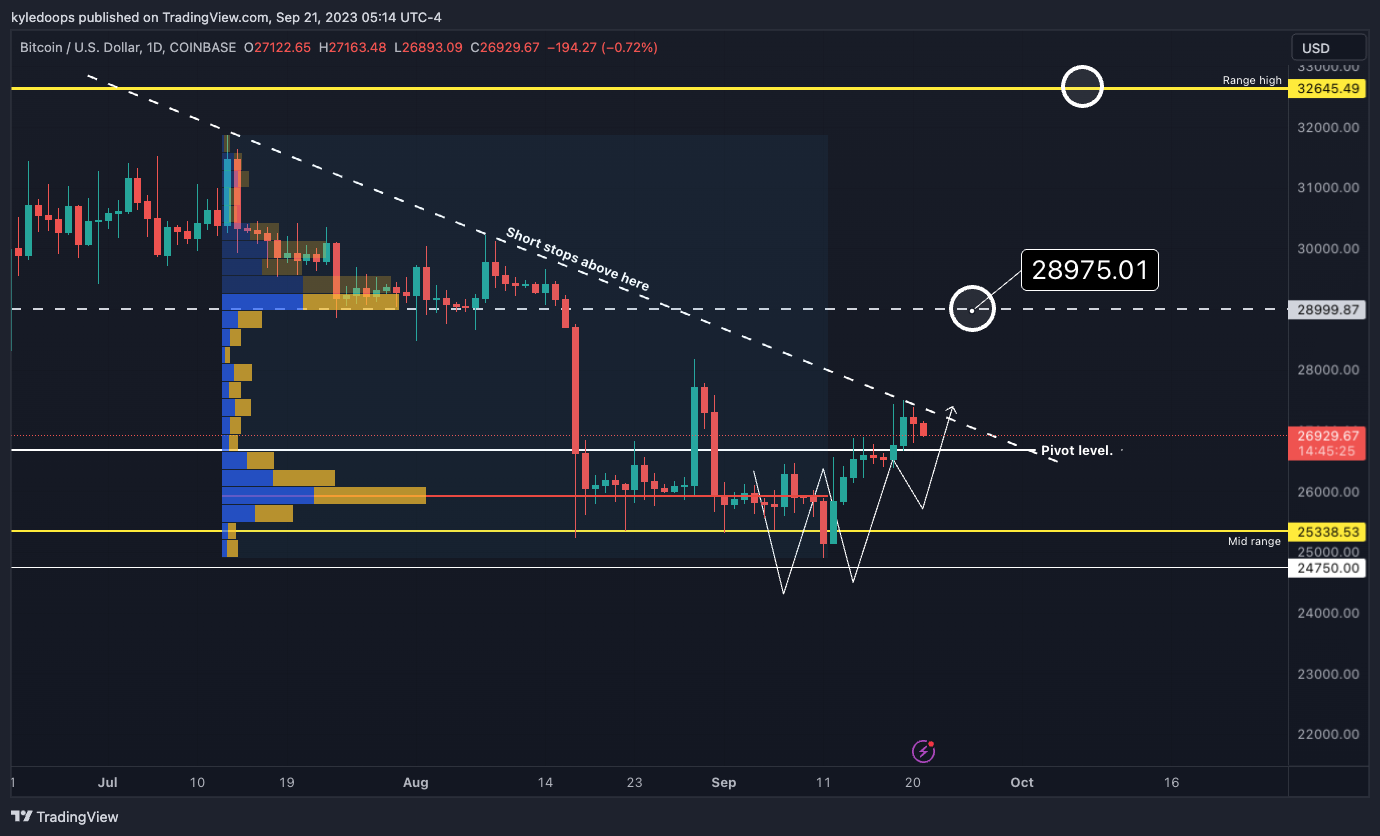
Bitcoin on the daily is holding above the pivot level with the RSI trending up.
If price can break the down-trending line, then short stops are likely to start triggering off, and then price might head to $28,975, which is the range quarterly level as well as the high-volume node.
Get and hold above that, and then $32,645 is the next major level. If we see a rejection from here, then $25,338 is the mid-level support, which must hold or price will go much lower.
Claim your Bitget sign-up bonuses here (details below).
Chart #4 - Bitcoin Dominance (BTC.D) 12-Hour
Chartist: Sheldon
(For the chart screenshot, click here.)
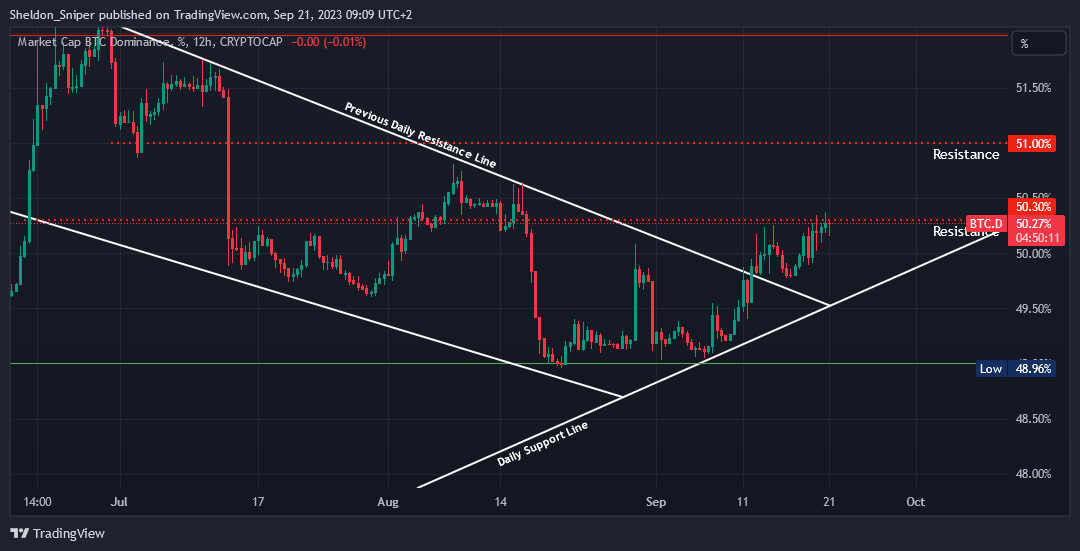
Bitcoin Dominance is currently at 50.3%, an area that has been acting as resistance over the last week.
I am looking for a rejection here, and for BTC.D to go down and test the next support at around 49.70%.
A break of 50.3% will not be good for the alts, where a move higher could take BTC.D to the next level of resistance at around 51%.
Claim your Bitget sign-up bonuses here (details below).
Chart #5 - Fear and Greed Index
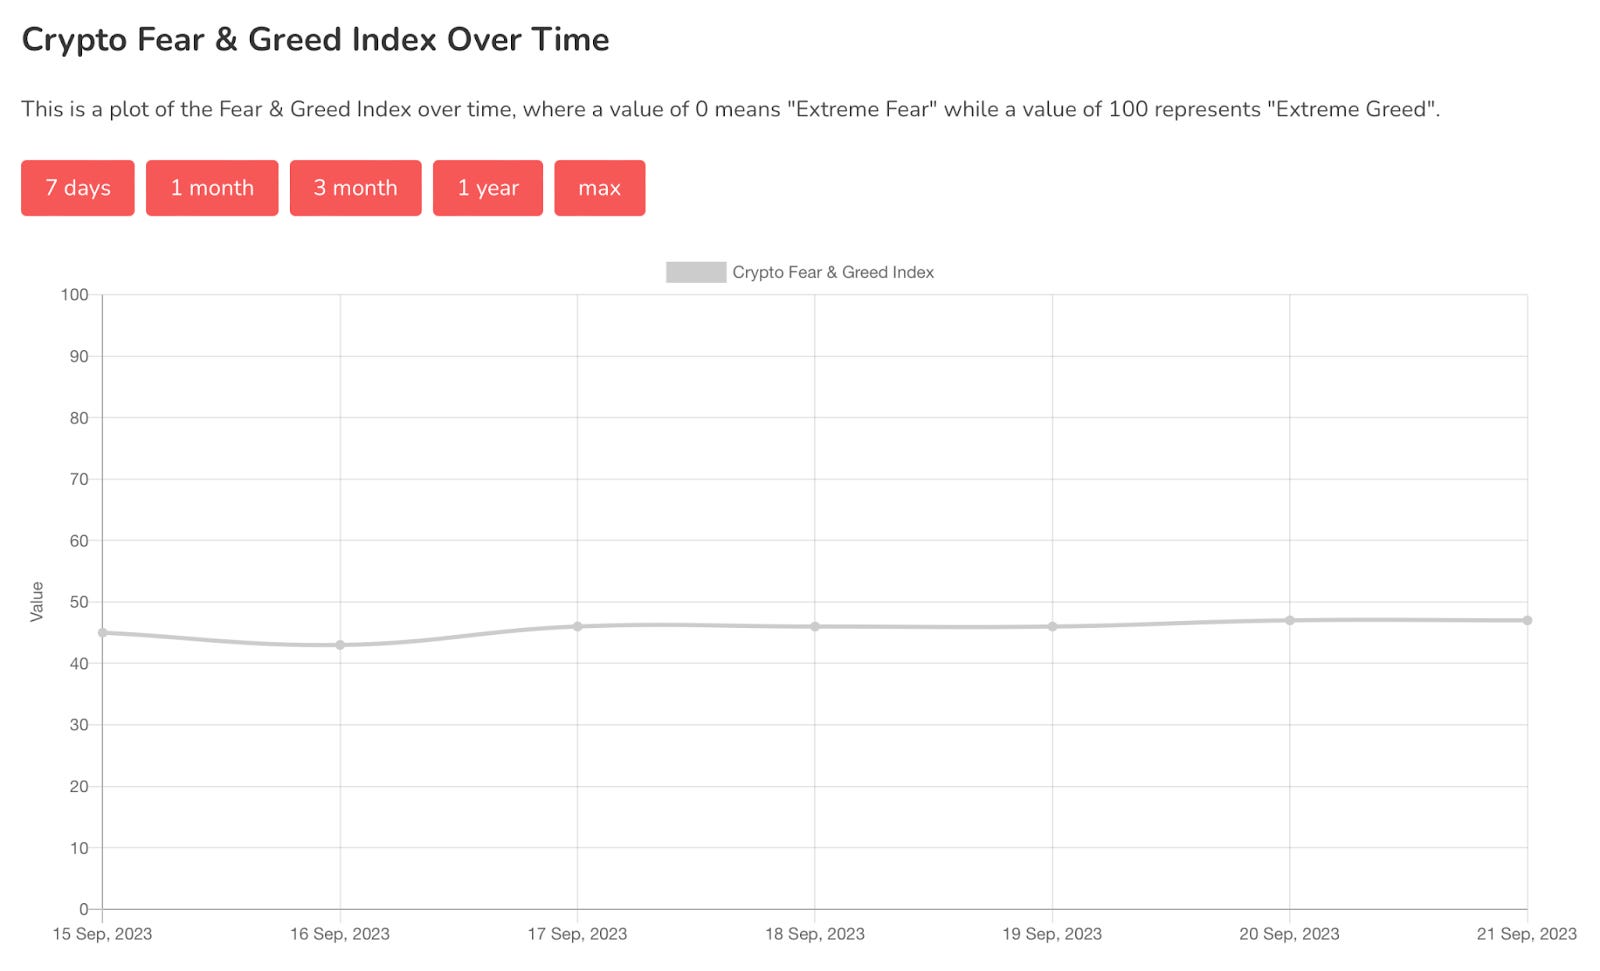
The Fear and Greed Index is sitting at 47 today, Neutral.
The highest the index has been over the past seven days is 47, and the lowest is 43.
Banter’s Take
Bitcoin bulls still have the edge but are narrowly holding above the pivot level. If the price can at least consolidate here for a little longer, then they likely get another shot at higher prices.
The FOMC came out as expected and now the market's trading range can return.
Stay safe my friends!
Go to our Crypto Banter Discord here where Sheldon and Kyle give updates on the charts and trades from The Daily Candle newsletter!