

📈📉 This is where we buy Arbitrum at! Bitcoin reaching breakout point!
📈📉 This is where we buy Arbitrum at! Bitcoin reaching breakout point!

Bitget winner - 7459906314
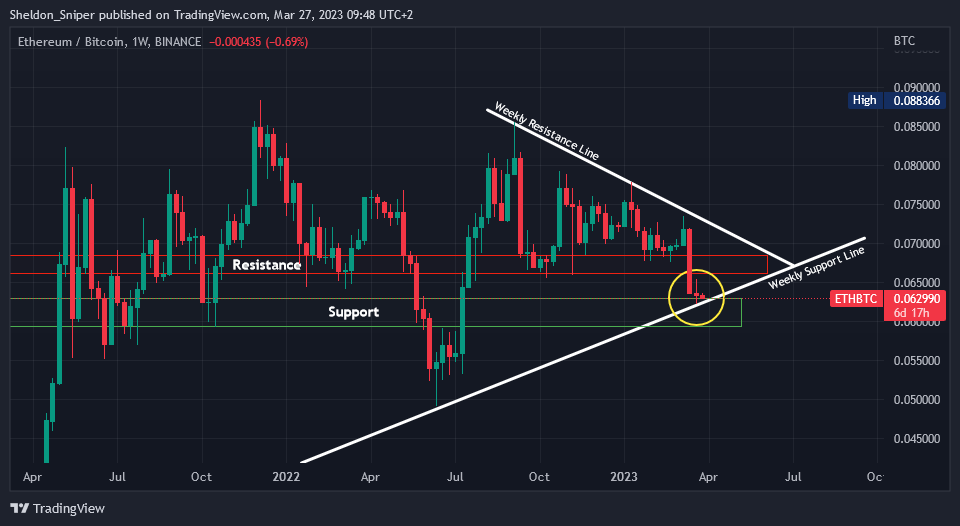
Chart #1 - Ethereum / Bitcoin (ETHBTC) 1-Week Chart
Chartist: Sheldon
(For the chart screenshot, click here.)
Over the last three weeks, BTC has been outperforming ETH, with the ETH/BTC ratio going from 0.0725 down to 0.063.
It now finds itself at crucial support, having reached its weekly support line that began forming in March 2021. I suspect a trend reversal may play out, sending the ratio up to resistance at 0.0675 which, if breached, could send it even higher to the 0.07 resistance level, where the weekly descending resistance line intersects.
Note that the current area of support extends all the way down to 0.06.
𝗣𝗿𝗶𝗺𝗲 𝗫𝗕𝗧
Sign up for a new Trading Account on Prime XBT!
Receive a deposit bonus of up to $7,000 with promo code: SheldonSniper
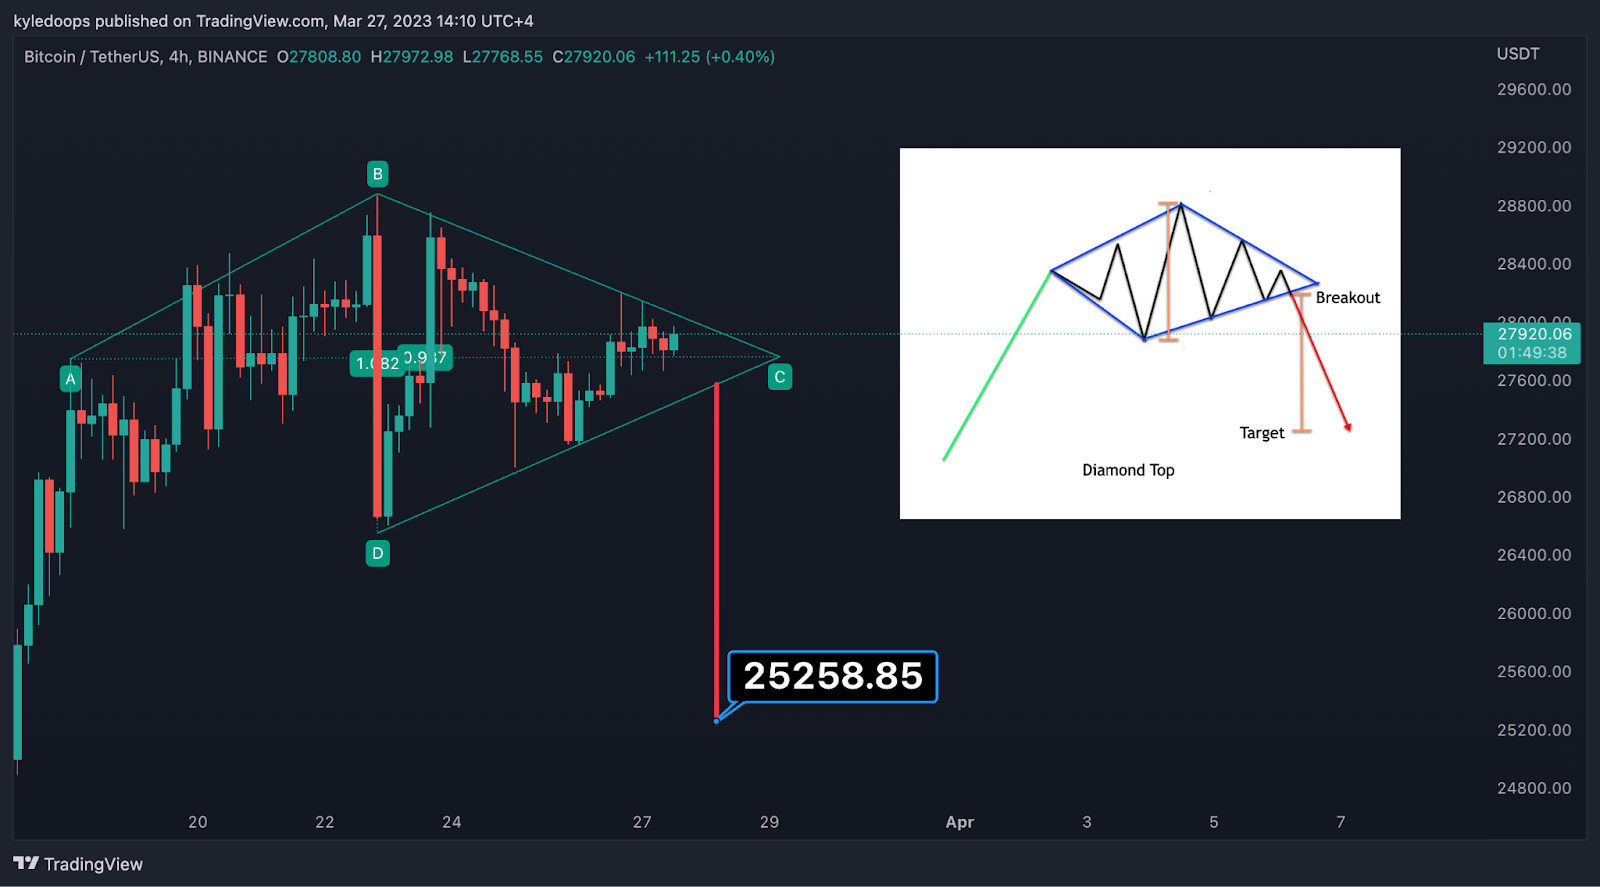
Chart #2 - Bitcoin (BTCUSDT) 4-Hour Chart
Chartist: Kyle
(For the chart screenshot, click here.)
Bitcoin is currently in a textbook-perfect diamond top pattern, which has a measured move down to $25,258.
Statistically, these patterns only play out 30% of the time, and patterns can easily morph into other shapes. I want you to understand this because even though there is risk of a pull-back occurring soon, it would not be a death sentence, but rather an opportunity to buy the dip, as bitcoin would be setting a higher low.
Therefore we’ll prepare to buy the dip between $25,000 - $26,000.
𝗣𝗿𝗶𝗺𝗲 𝗫𝗕𝗧
Sign up for a new Trading Account on Prime XBT!
Receive a deposit bonus of up to $7,000 with promo code: KyleDoops
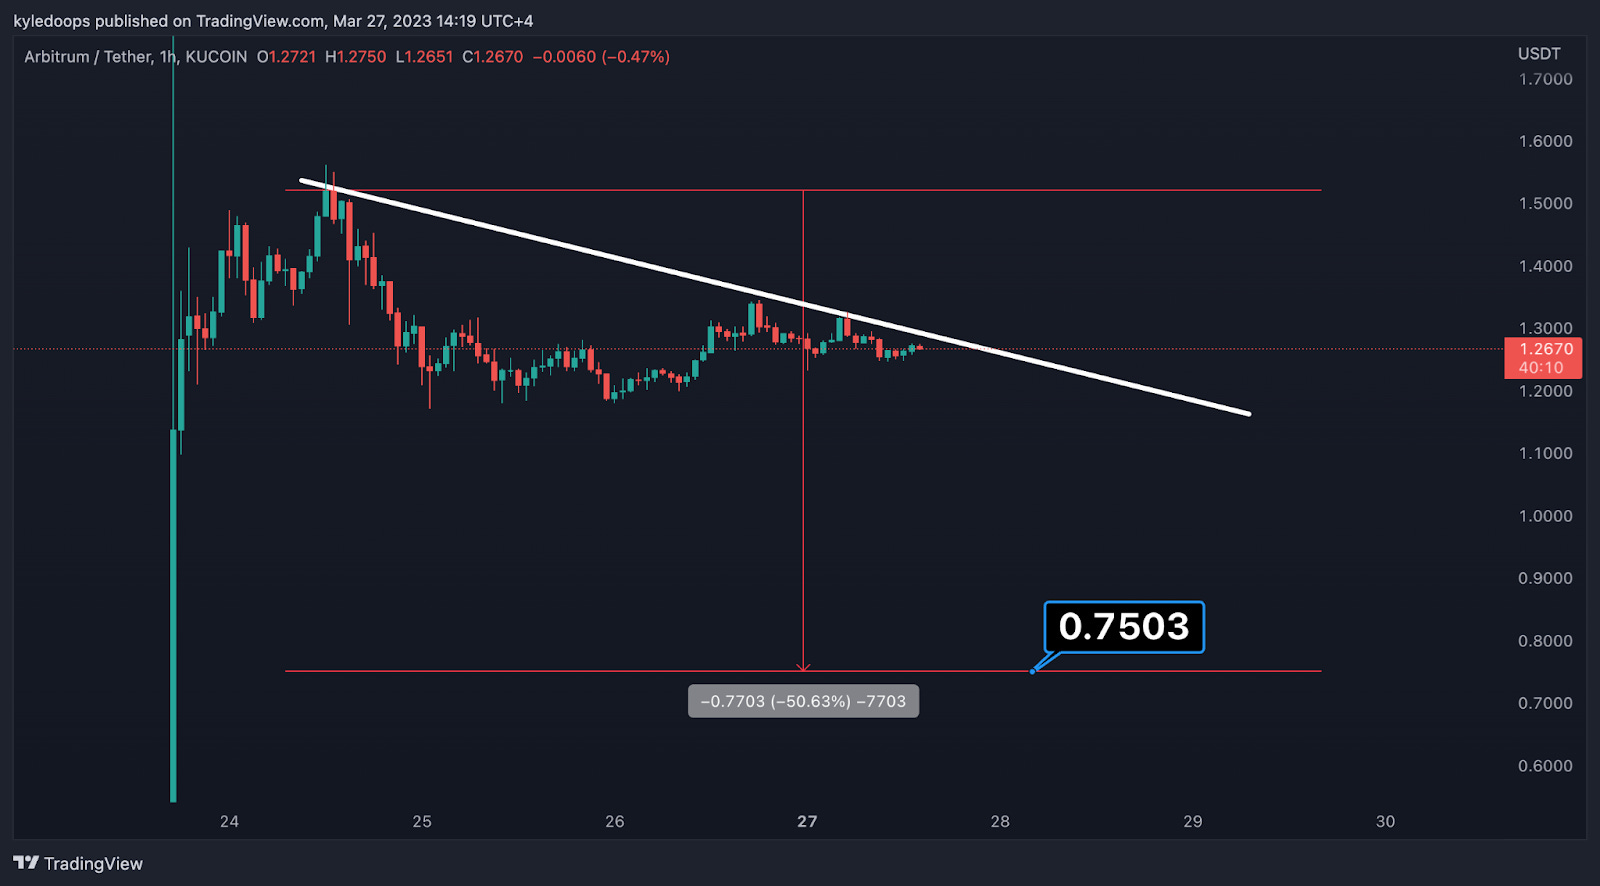
Chart #3 - Arbitrum (ARBUSDT) 1-Hour Chart
Chartist: Kyle
(For the chart screenshot, click here.)
Although this is still a very young chart, ARB has been super hyped, and many want to know where to get in.
My general rule regarding IPOs or newly listed coins is to wait for a -50% pullback following a local top. ARB may have already set that local top, so we can place a diagonal down-trending line on the chart. By doing that, we see that distribution may have possibly begun.
We will start to dollar cost average once ARB gets to 75 cents.
Claim your Bitget sign-up bonuses here (details below).
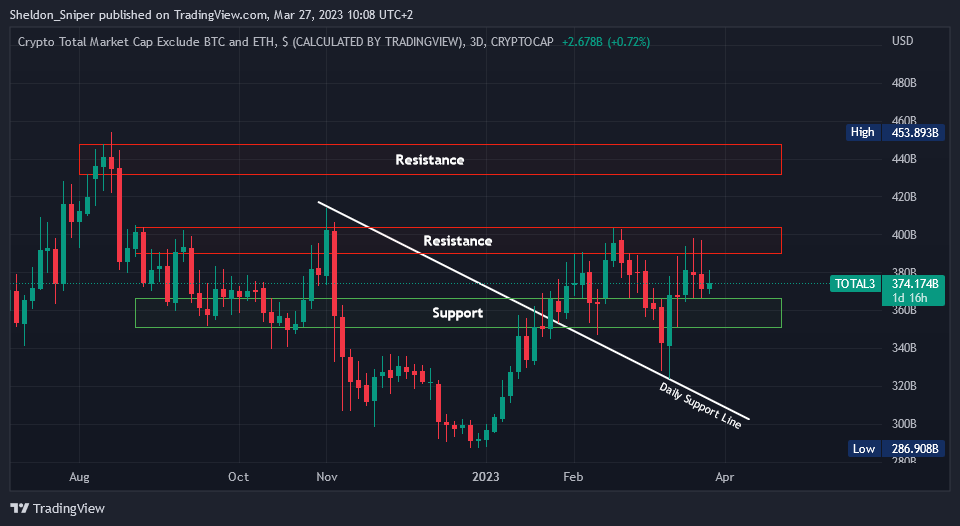
Chart #4 - TOTAL3 3-Day Chart
Chartist: Sheldon
(For the chart screenshot, click here.)
The TOTAL3 has been consolidating around $370B (support) for the last two weeks.
Over the last three months, most cash has been flowing into BTC, but it looks like the TOTAL3 might be getting ready to pump. The next major level of resistance is at $400B, and after that at $440B, but if the current support does not hold, the next one is at $320B - $330B.
Claim your Bitget sign-up bonuses here (details below).
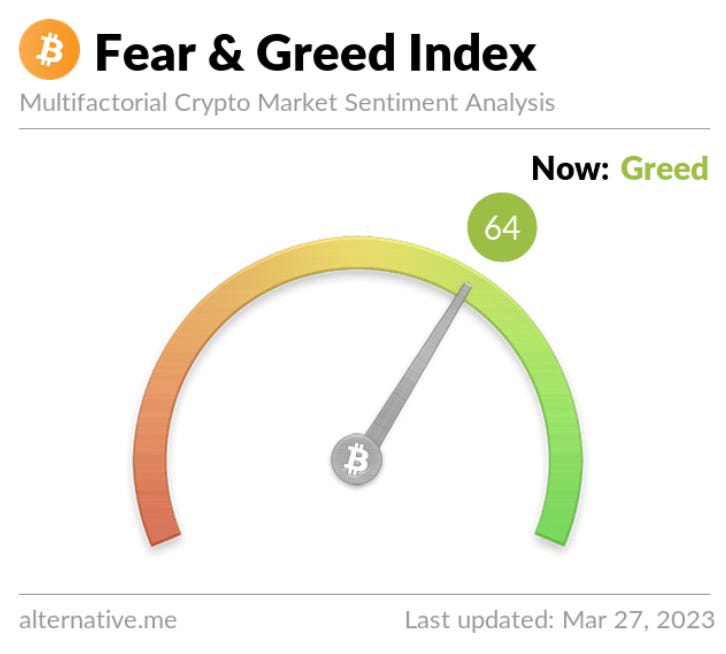
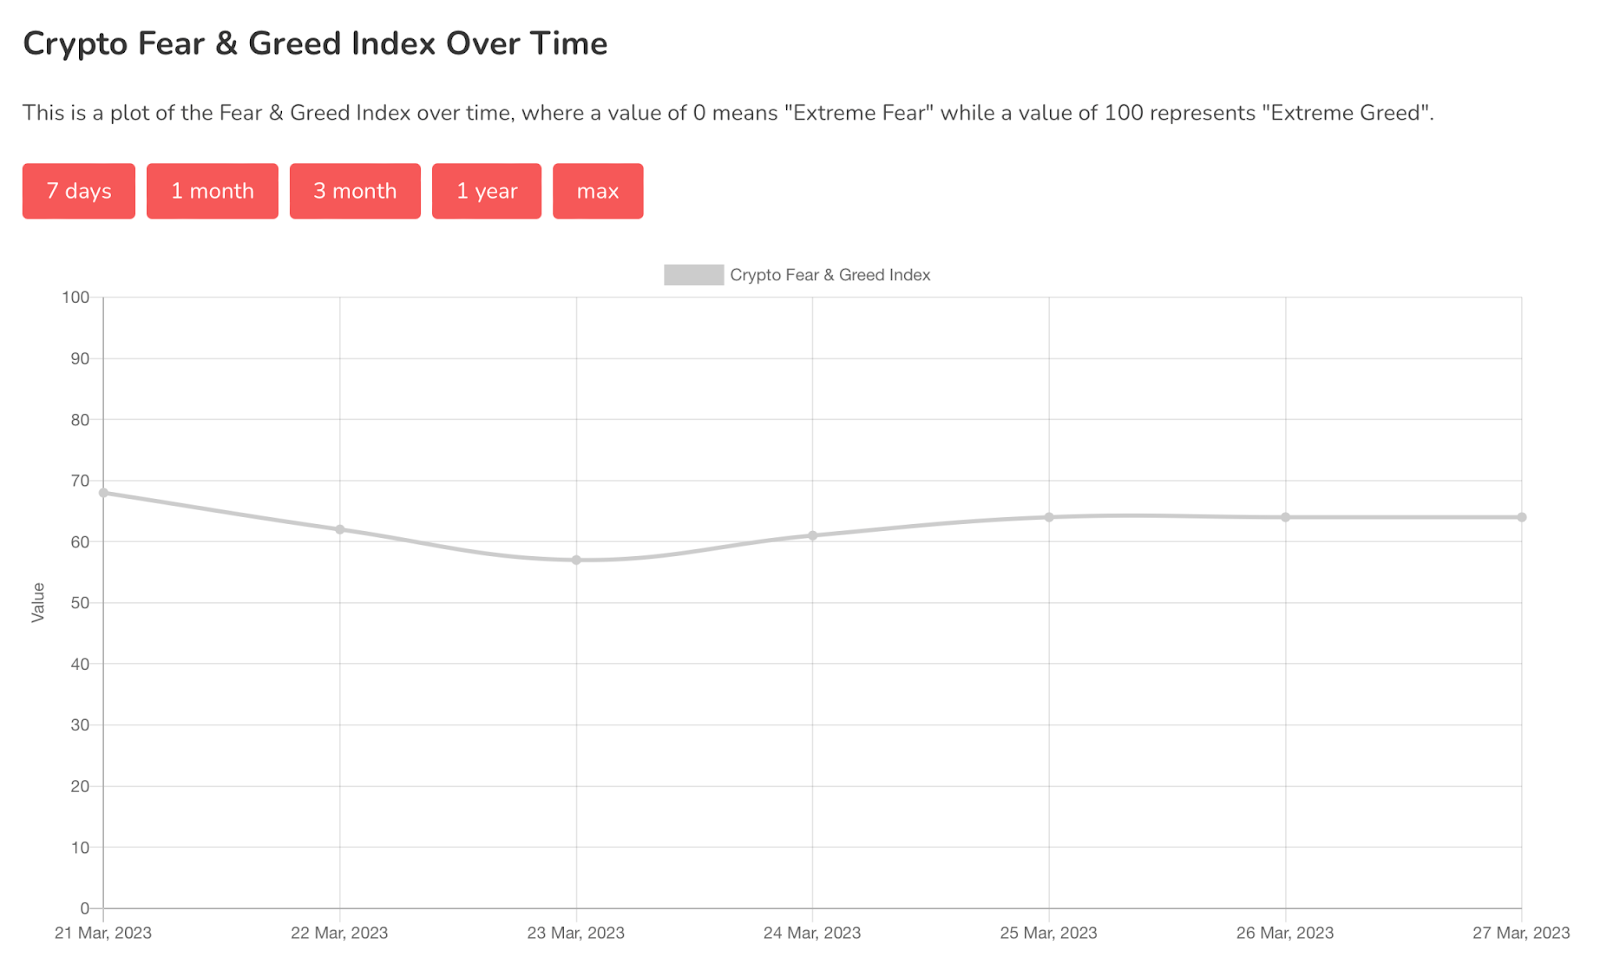
Chart #5 - Bitcoin Fear and Greed Index
The Bitcoin Fear and Greed Index is sitting at 64 today, indicating Greed.
The highest the index has been over the past seven days is 68, and the lowest is 57.

Overall Market Sentiment (Banter’s Take)
The market has started consolidating very tightly. That indicates a volatile move is incoming - likely sometime during the week.
The case for whether the market pumps or crashes is 50-50, so we'll plan accordingly and manage risk very closely.
Stay safe my friends!
Go to our Crypto Banter Discord here where Sheldon and Kyle give updates on the charts and trades from The Daily Candle newsletter!
Bybit winner - 34655183