

📈📉 This is where we long DYDX! DOGE rejecting from crucial level!
📈📉 This is where we long DYDX! DOGE rejecting from crucial level!

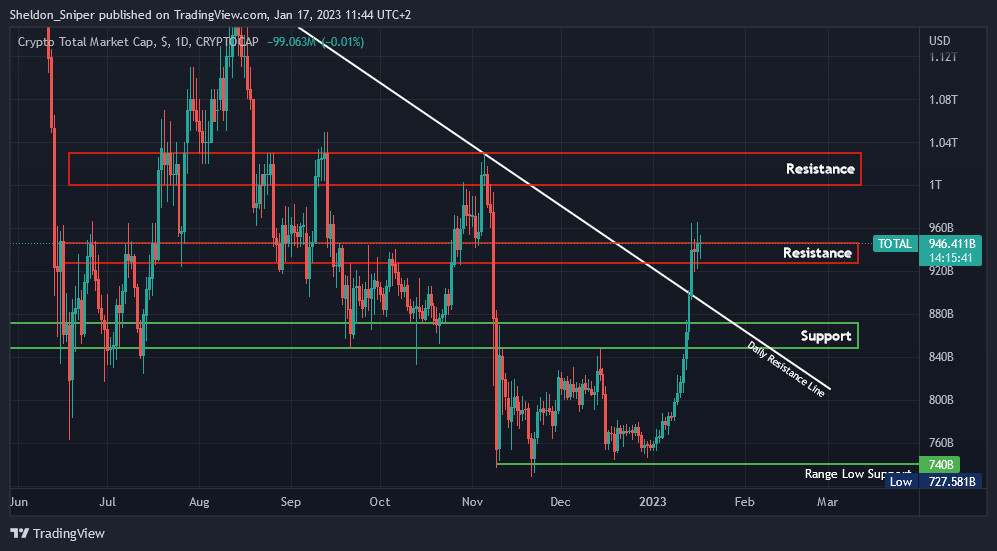
Chart #1 - Crypto Total Market Cap (TOTAL) 1-Day Chart
Chartist: Sheldon
(For the chart screenshot, click here.)
The TOTAL has been trading between $935B - $960B (area of resistance) for the last four days, possibly consolidating before a push even higher from here.
If the $960B level breaks, the next big area of resistance is at the $1T level (there have been three attempts over the last five months to break through that level). If the market drops again, we find the next support at $860B (previous daily descending resistance line).
Check our Crypto Banter Discord here for updates!
Follow me on Twitter for urgent updates on my trading progress!
Claim your Bitget sign-up bonuses here (details below).
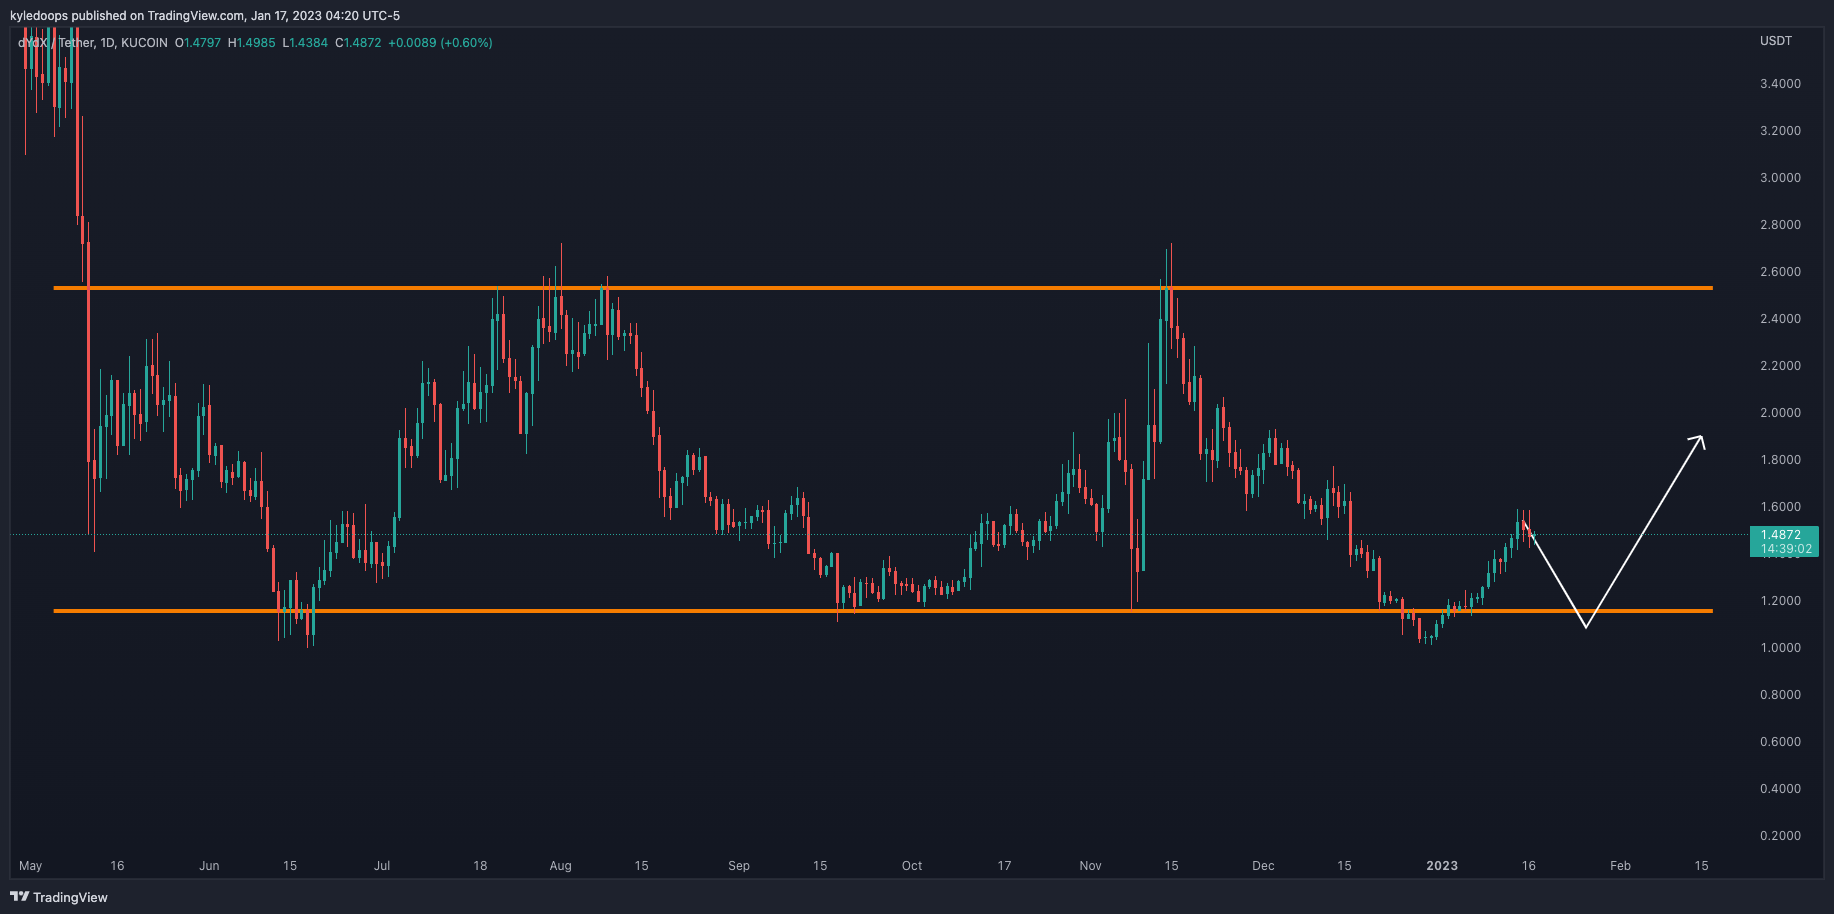
Chart #2 - dYdX (DYDXUSDT) 1-Day Chart
Chartist: Kyle
(For the chart screenshot, click here.)
DYDX has been moving within this range for some time.
Once bitcoin pulls back, I will be watching DYDX for an opportunity to long the next higher low, as shown in the chart. That would mean one more possible test of the range-low at $1.16.
Check our Crypto Banter Discord here for updates!
Make sure to follow me on Twitter, where I will post updates on my trades as they unfold!
Claim your Bitget sign-up bonuses here (details below).

Deribit is the leading Bitcoin and Ethereum Options Exchange for crypto traders.
Deribit offers a robust, reliable, and lighting-fast options platform for high-performance trading.
Sign up for a Deribit account here. Follow Ran’s daily YouTube show, and check The Daily Candle newsletter every Friday to learn more about options trading with Deribit.
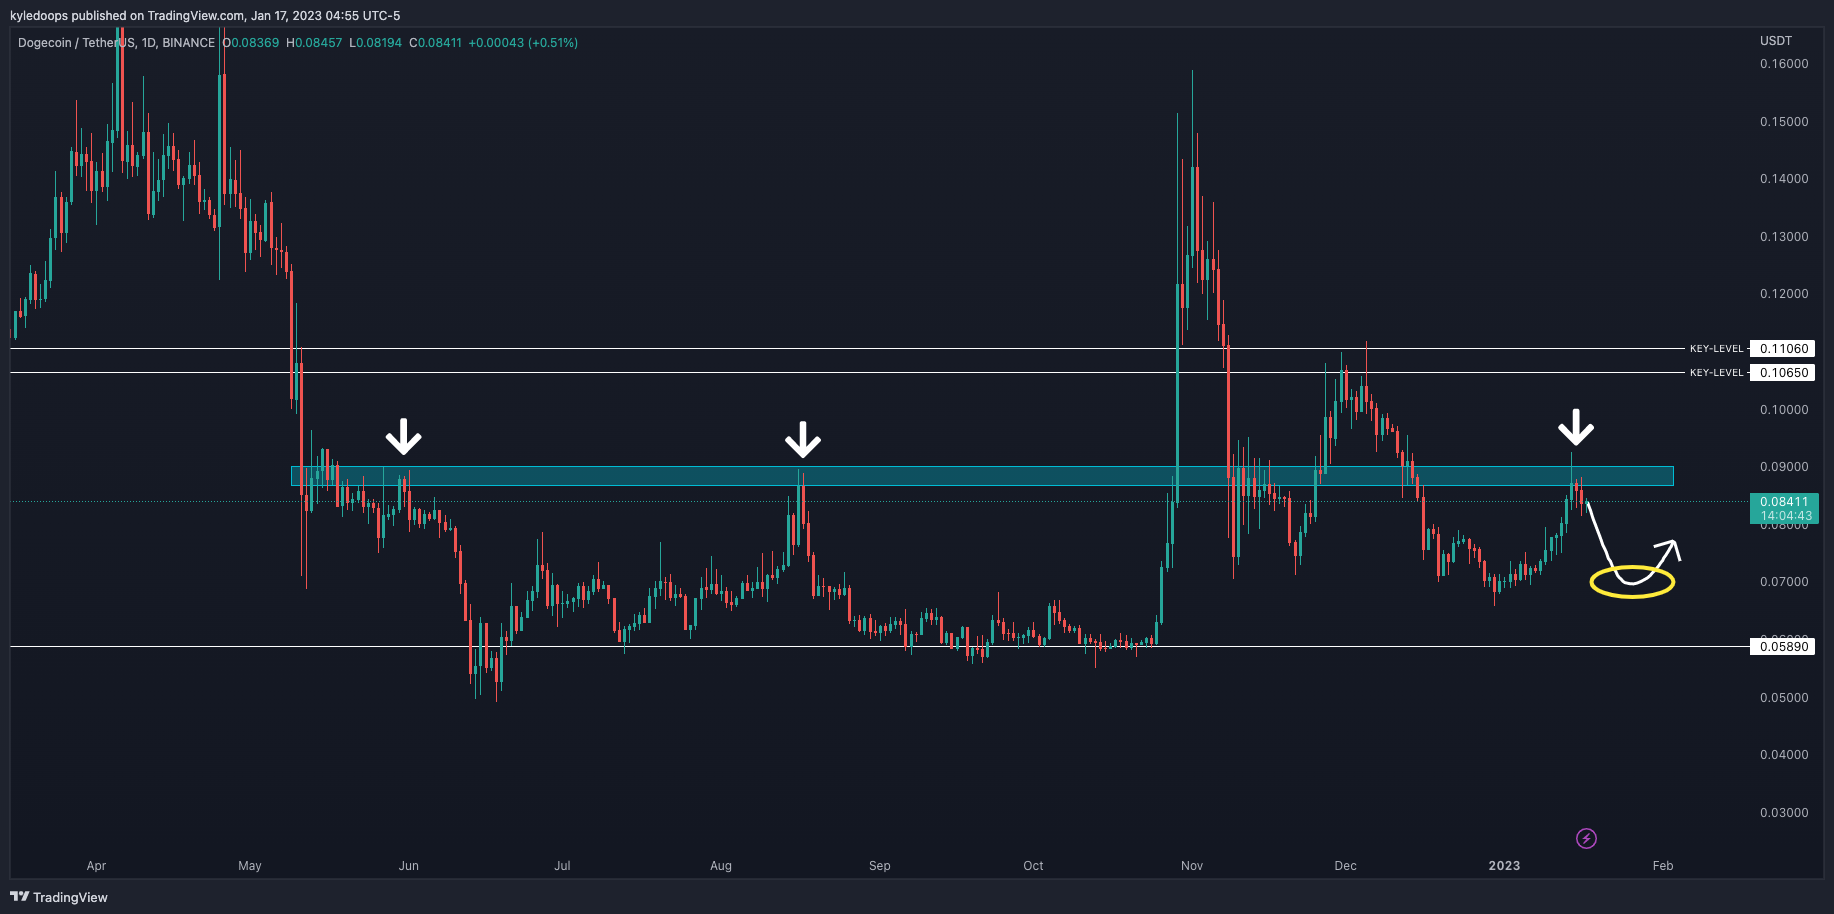
Chart #3 - Dogecoin (DOGEUSDT) 1-Day Chart
Chartist: Kyle
(For the chart screenshot, click here.)
I am keeping a close eye on DOGE.
It is stuck within a massive range and is now rejecting from the blue box at $0.087 - a key level in the past, as seen in the chart.
Once bitcoin pulls back, I will look for a sweep near the recent lows and consider going long at $0.068, where the next higher low could form.
Check our Crypto Banter Discord here for updates!
Make sure to follow me on Twitter, where I will post updates on my trades as they unfold!
Claim your Bitget sign-up bonuses here (details below).
Chart #4 - Bitcoin Dominance (BTC.D) 1-Day Chart
Chartist: Sheldon

(For the chart screenshot, click here.)
After bottoming out in September - just below 39% - BTC.D saw a five-month uptrend, moving to 43%.
It has just entered a significant area of resistance and has its indicators overbought (on higher time frames), so there could be a rejection at this level in the next few days.
During the last five-month uptrend, BTC.D was trading within a massive rising channel structure, so, at some stage, it has a good chance of breaking to the downside.
Check our Crypto Banter Discord here for updates!
Follow me on Twitter to get all the updates on my personal trading progress!
Claim your Bitget sign-up bonuses here (details below).
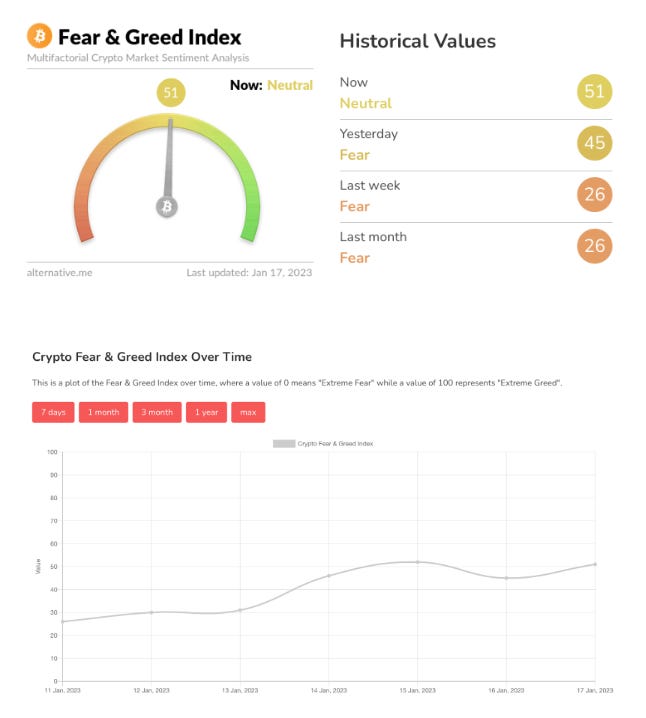
Chart #5 - Bitcoin Fear and Greed Index
The Bitcoin Fear and Greed Index is sitting at 51 today, in Neutral territory.
The highest the index has been over the past seven days is 52, and the lowest is 26.
Overall Market Sentiment (Banter’s Take)
Many charts are moving into resistance now, and a pullback is likely just a matter of when. Once a pullback occurs, a lot of sidelined money will potentially hit the market to fight investors' recent FOMO.
Stay safe my friends!
Disclaimer
The Daily Candle (issued by Crypto Banter) is a newsletter for entertainment purposes only.
All opinions expressed by the publisher, writers and chartists should not be construed as financial advice, and do not necessarily reflect the views of Crypto Banter. The publisher, writers and chartists may hold positions in the tokens and assets discussed. Readers are encouraged to do their own research.