

📈📉 THIS Low Cap Could EXPLODE SOON!
📈📉 THIS Low Cap Could EXPLODE SOON!
PLUS: FET to SURGE by 60%?
Overview
Chart #1 - Cosmos (ATOMUSDT) 3-Day
Chart #2 - Decimated (DIOUSDT) Daily
Chart #3 - Fetch.ai (FETUSD) Daily
Chart #4 - Ethereum (ETHUSDT) Weekly
Chart #5 - Fear and Greed Index
Chart #1 - Cosmos (ATOMUSDT) 3-Day
Chartist: Sheldon
(For the chart screenshot, click here.)
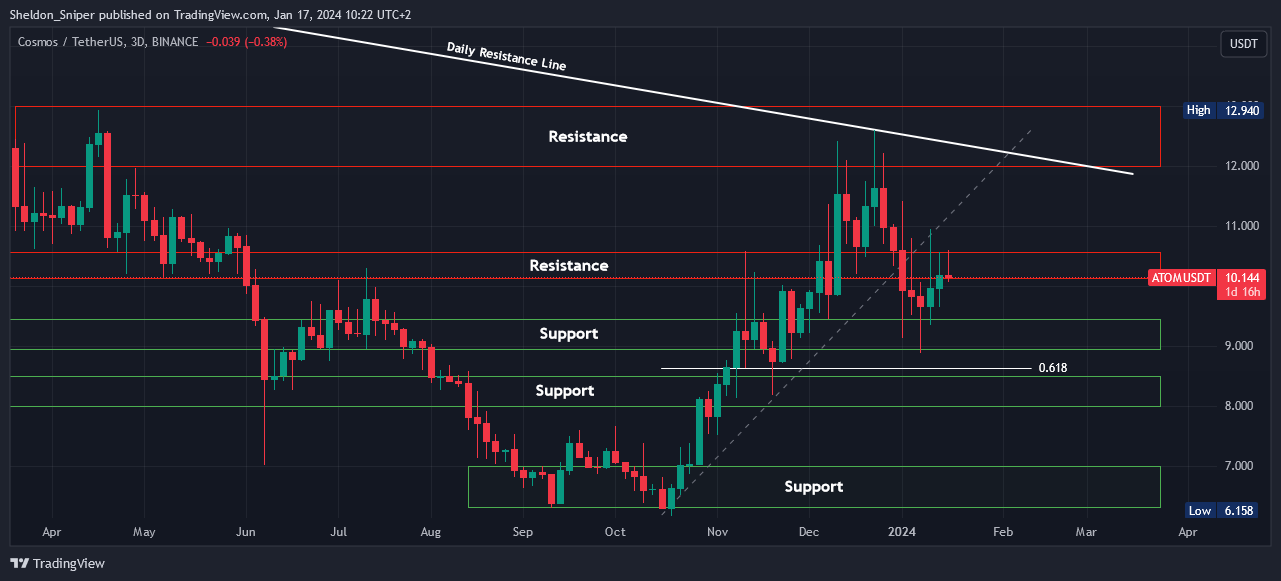
This week, COSMOS (ATOM) faced rejection at $10.50 and has since retraced, currently trading around $10.15.
If the bottom of the range resistance level at $10.00 is breached, the next support lies at $9.00 - $9.50, with the level below that being the 0.618 Fibonacci level, between the low of October and the high of December, around $8.66.
Sign-up and trade on Bybit today.
Exclusive $30,000 deposit rewards and bonuses up for grabs!
Chart #2 - Decimated (DIOUSDT) Daily
Chartist: Kyle
(For the chart screenshot, click here.)
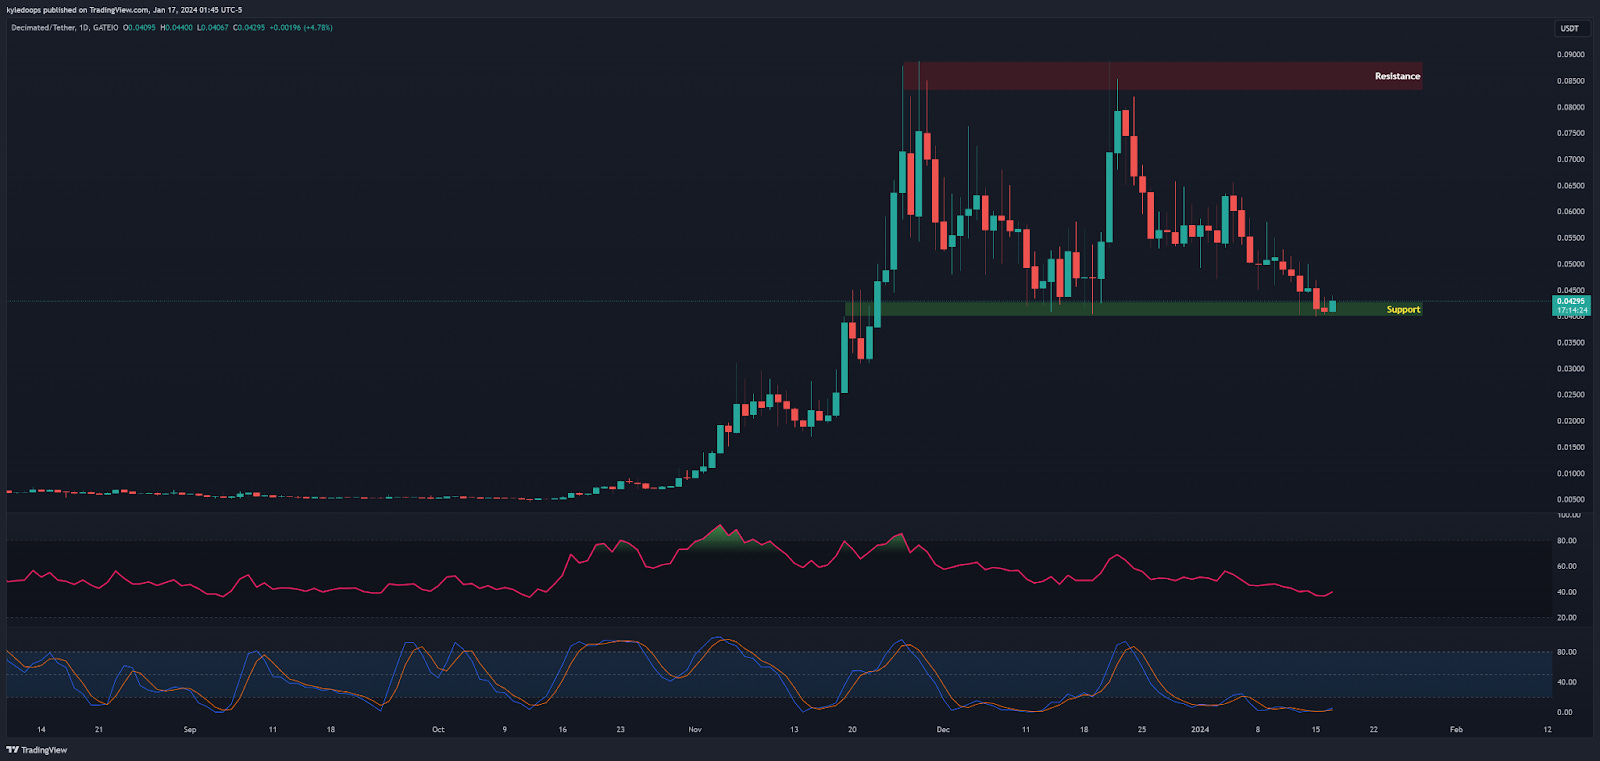
DIO is a gaming token with a small market cap of $17 million, operating within the Solana ecosystem.
Its current price is $0.042, and it's currently positioned on a significant support/resistance level at $0.040. Decimated has limited exposure to retail traders as it is listed on only two centralized exchanges.
Given that GameFi has a capitalization of $20.6 billion, Decimated (DIO) is still in its very early stages of development and adoption.
Claim your Bitget sign-up bonuses here (details below).

Outsmart 99% Of The Market!
Get full access into our Discord And Telegram group, where you'll find all of our premium content!
👉 Trade Signals!
👉 Trade Set-Ups!
👉 Trading Challenges!
👉 Education!
👉 SO MUCH MORE!
Chart #3 - Fetch.ai (FETUSD) Daily
Chartist: Kyle
(For the chart screenshot, click here.)
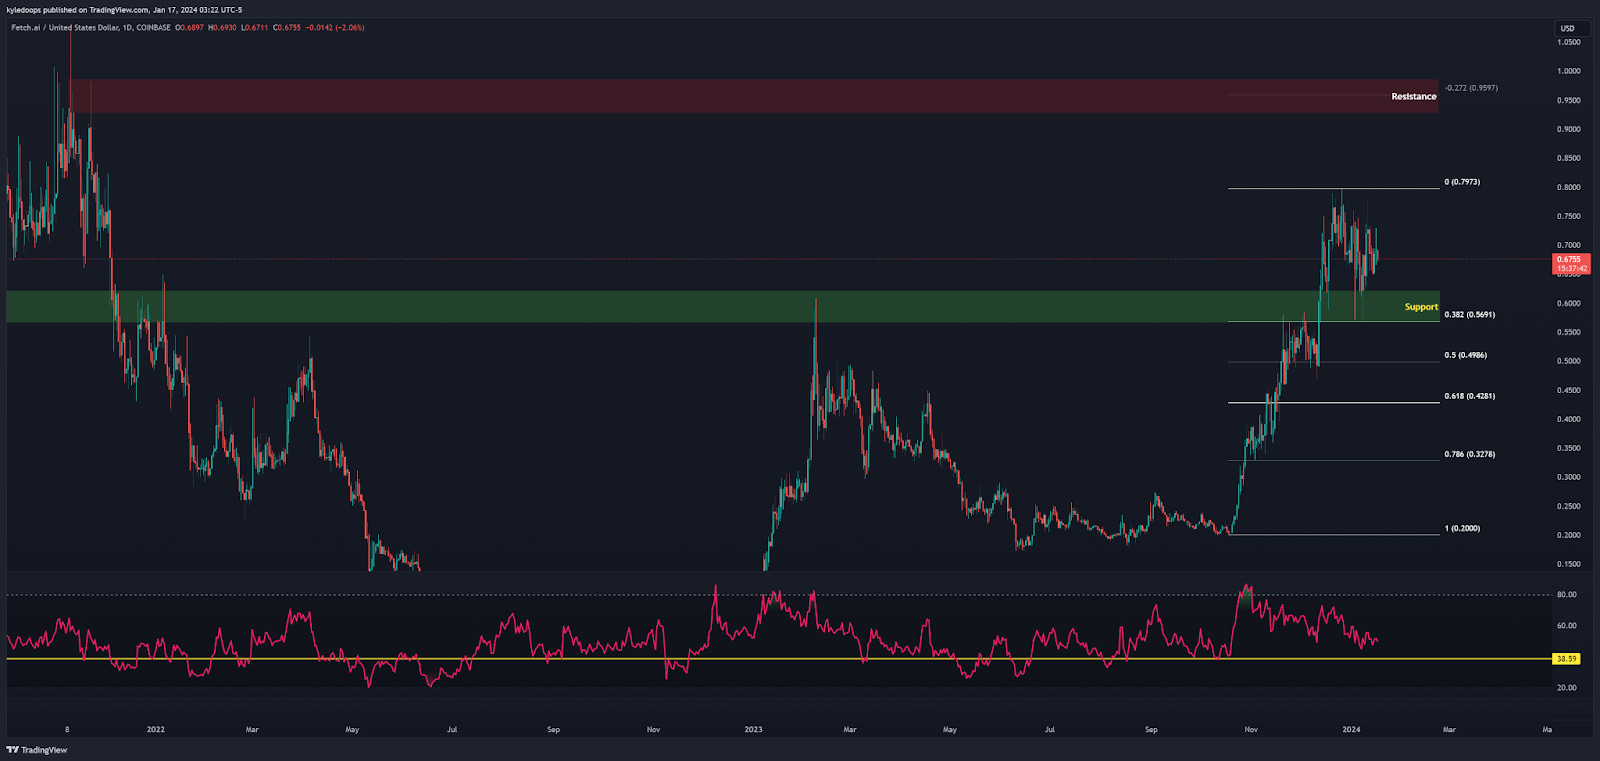
FET has been in an accumulation phase since last December, with a market capitalization of $703 million within the broader Artificial Intelligence market, which has a total capitalization of almost $9 billion.
The key support level is at the 0.382 Fib level, with a price of $0.57.
When bulls regain control, the next target could be in the range of $0.93 to $0.95. However, if bears push the price below $0.57, the next support can be found at $0.50.
Claim your Bitget sign-up bonuses here (details below).
Chart #4 - Ethereum (ETHUSDT) Weekly
Chartist: Sheldon
(For the chart screenshot, click here.)
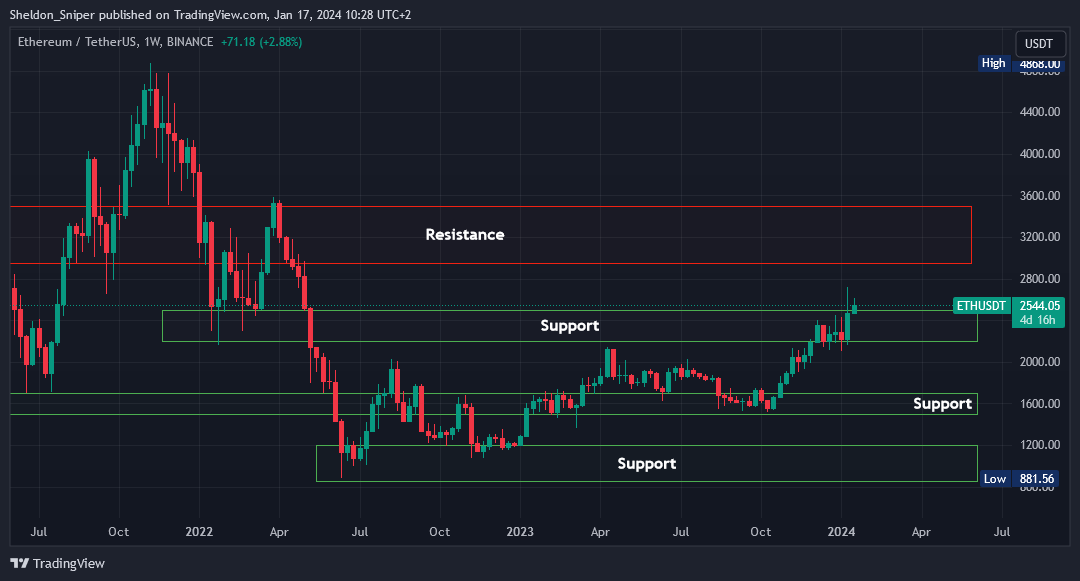
ETH has moved away from the $2,200 bottom of the range support area and is currently trading just above the top of the range support at approximately $2,500.
The expectation for the next couple of weeks is for funds to continue shifting from BTC into ETH, potentially driving the price of ETH higher.
It may test the next major resistance area between $2,900 and $3,500. This range was last tested almost two years ago.
Claim your Bitget sign-up bonuses here (details below).
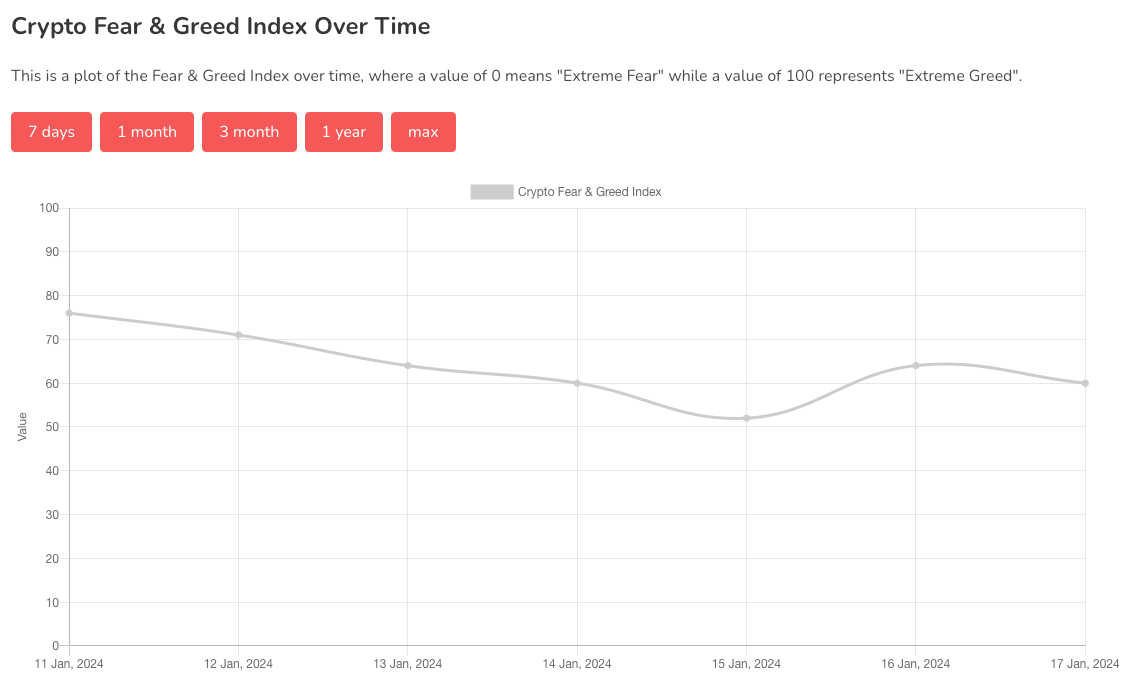
Chart #5 - Fear and Greed Index
The Fear and Greed Index is sitting at 60 today, indicating Greed.
The highest the index has been over the past seven days is 76, and the lowest is 52.
Banter’s Take
As of today, Bitcoin's price is trading at $43,000, showing a slight increase from yesterday, up by less than 0.5%.
The $40,000 level has remained solid since the 11th of December.
Bitcoin appears to be slowly forming a rising triangle, although the majority of market participants expect a potential downturn. It's important to analyze price action level by level and take it day by day.
Stay safe my friends!
Go to our Crypto Banter Discord here where Sheldon and Kyle give updates on the charts and trades from The Daily Candle newsletter!