

📈📉 THIS Meme Coin Could 3x SOON!
📈📉 THIS Meme Coin Could 3x SOON!
Bitcoin MUST Hold THESE Levels!
Overview
Chart #1 - Bitcoin (BTCUSDT) 12-Hour
Chart #2 - Pyth Network (PYTHUSD) Daily
Chart #3 - Bittensor (TAOUSDT) Daily
Chart #4 - Dogecoin (DOGEUSDT) 8-Hour
Chart #5 - Fear and Greed Index
Chart #1 - Bitcoin (BTCUSDT) 12-Hour
Chartist: Sheldon

(For the chart screenshot, click here.)
We need to be aware that BTC is again testing the $71,800 - $73,800 area of resistance. It has been testing this level over the last three days, and if it rejects here and retraces, it could bring the rest of the market down with it.
If there is a rejection, the next levels of support are sitting at around $65,000, $60,700, $57,000 and $53,000.
So, we need to manage our risk tightly over the next couple of days.
Sign-up and trade on Bybit today.
Exclusive $30,000 deposit rewards and bonuses up for grabs!
Chart #2 - Pyth Network (PYTHUSD) Daily
Chartist: Kyle
(For the chart screenshot, click here.)
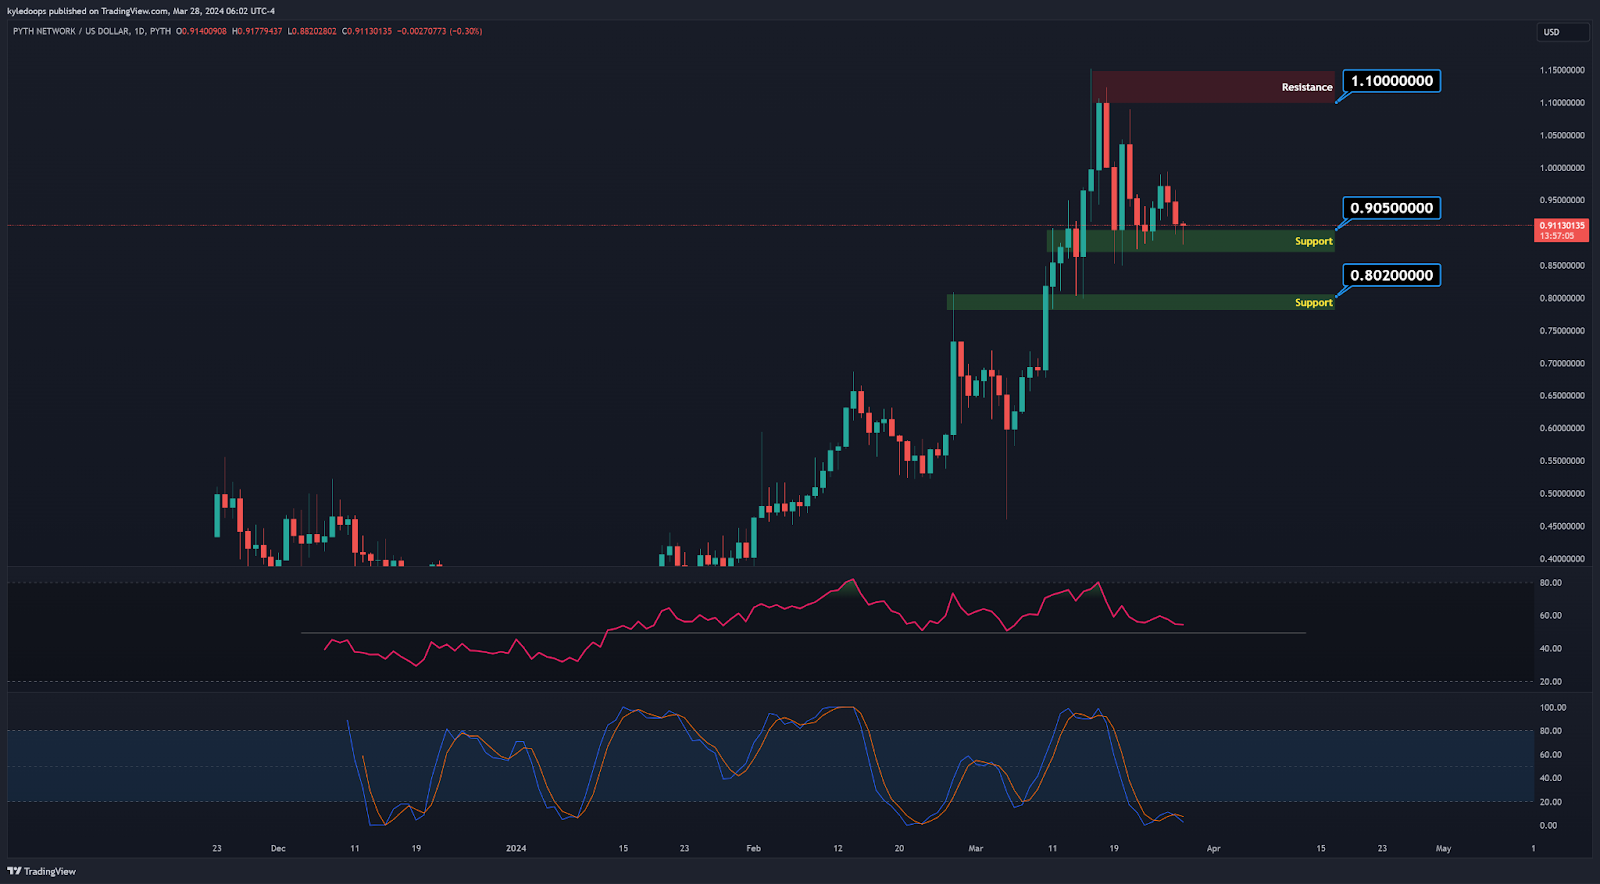
PYTH is compressing down to $0.905 where we have a support zone, and its building up.
It’s a good area to ladder into our positions. If it fails to hold this current level, the next support is at $0.802.
But, if it bounces from here, our target is $1.10
Entry: $0.905
TP: $1.10
Stop Loss: $0.78
Claim your Bitget sign-up bonuses here (details below).

Outsmart 99% Of The Market!
Get full access into our Discord And Telegram group, where you'll find all of our premium content!
👉 Trade Signals!
👉 Trade Set-Ups!
👉 Trading Challenges!
👉 Education!
👉 SO MUCH MORE!
Chart #3 - Bittensor (TAOUSDT) Daily
Chartist: Kyle
(For the chart screenshot, click here.)
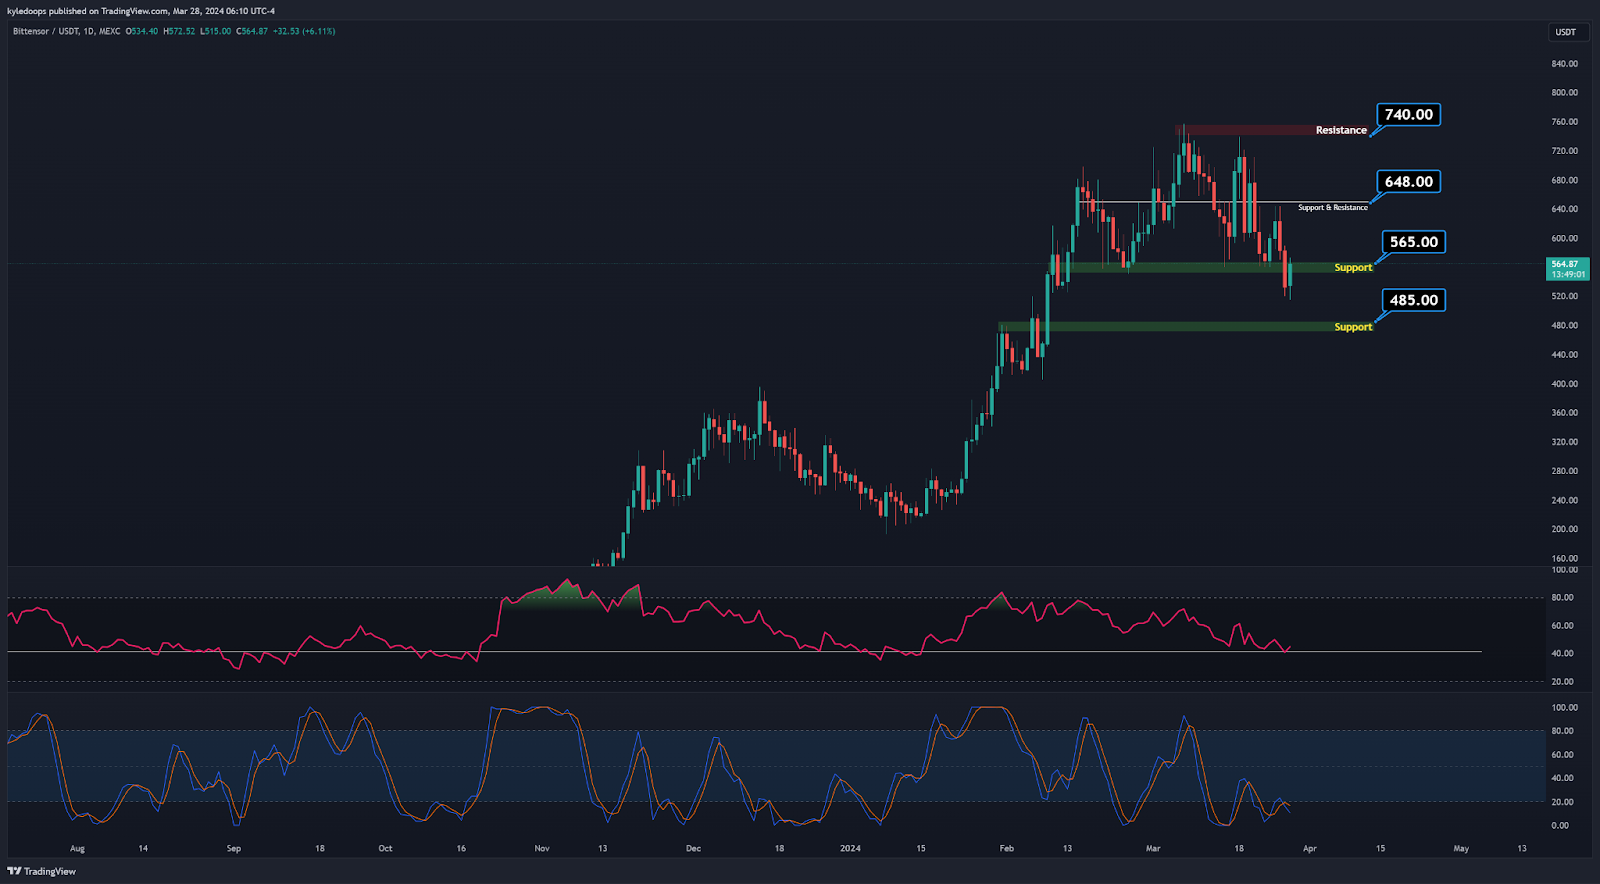
We have a deviation under the current support at $565. If TAO reclaims this level we can ladder into our positions to target the resistance at $740.
There is an in-between level acting as resistance and support where price action flipped, so we may want to grab some of our profits there.
Entry: $565
TP1: $648
TP2: $740
Stop Loss: $515
Claim your Bitget sign-up bonuses here (details below).
Chart #4 - Dogecoin (DOGEUSDT) 8-Hour
Chartist: Sheldon

(For the chart screenshot, click here.)
Over the last couple of weeks, DOGE has been bullish, moving up nicely! But at the same time it is lagging behind the other memes. If DOGE can break though the current level of resistance, we might see a decent move up to the next one.
Entry: At the break and a retest of the current $0.20500 level of resistance, we’ll enter into a spot long trade. Price needs to open and close a 4HR candle above this level before we enter the trade.
TP1: $0.32 - $0.35 (56% - 71%)
TP2: Higher up at $0.50 - $0.60 (144% - 193%)
Stop Loss: Just below $0.18
Claim your Bitget sign-up bonuses here (details below).
Chart #5 - Fear and Greed Index
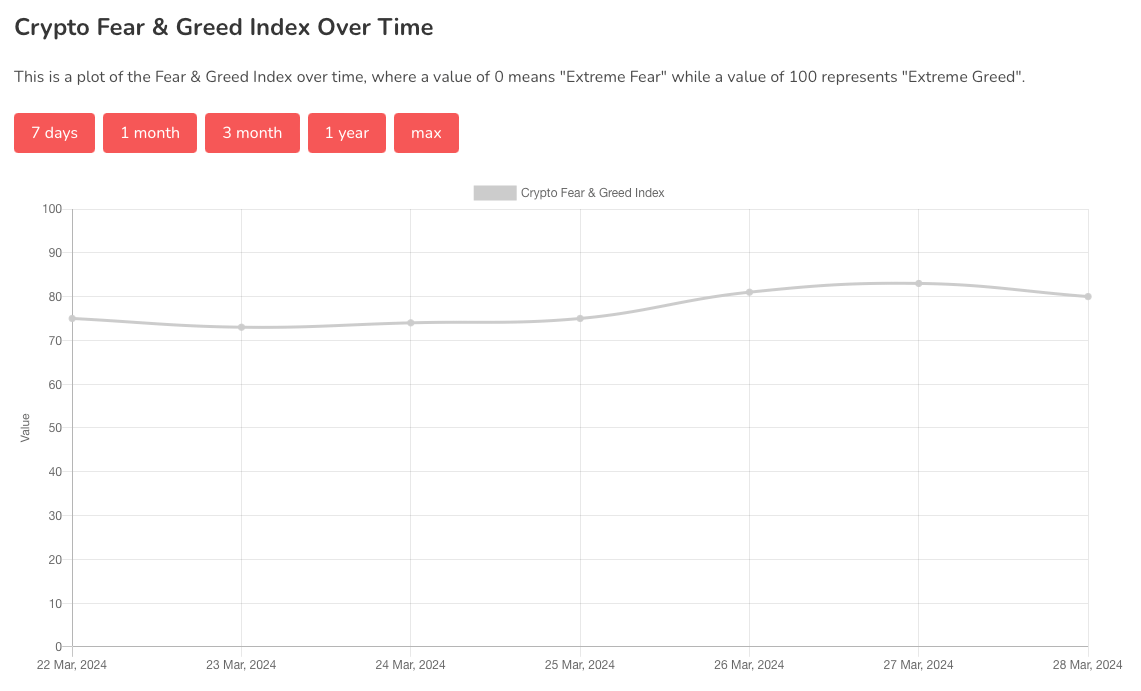
The Fear and Greed Index is sitting at 80 today, indicating Extreme Greed.
The highest the index has been over the past seven days is 83, and the lowest is 73.
Banter’s Take
Bitcoin has consistently touched the $71,500 mark throughout the week. As it persists, the likelihood of a breakthrough increases significantly, forming an ascending triangle.
Meanwhile, it is also crucial for price to maintain well above $69,300. Therefore, as we approach the week's close, we need to closely monitor these two levels and adjust our risk management strategies accordingly. Additionally, we are nearing the end of the month and quarter, making this an especially critical time!
Stay safe my friends!
Go to our Crypto Banter Discord here where Sheldon and Kyle give updates on the charts and trades from The Daily Candle newsletter!