


📈📉 This Spells Bad News for Bitcoin and Stocks! SOL Breakout Imminent?

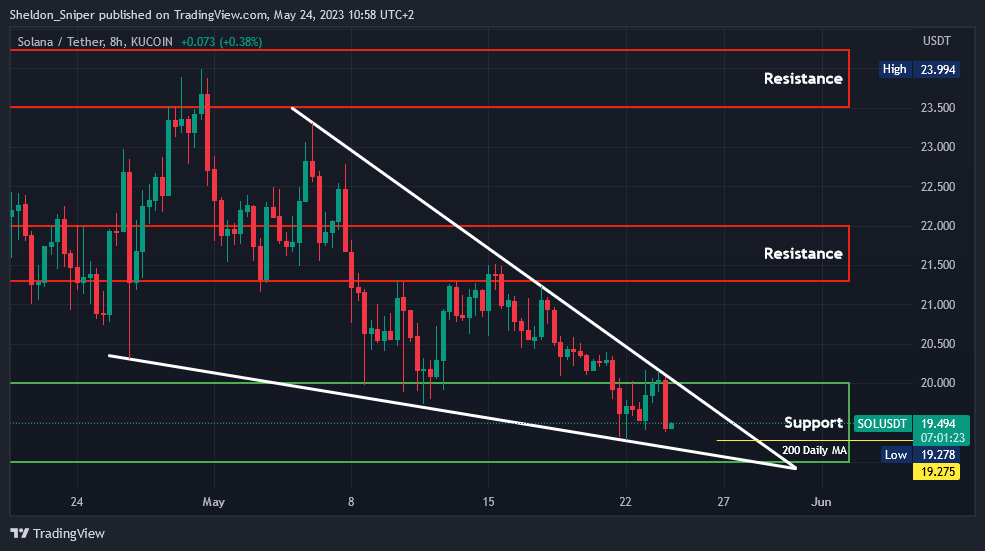
Chart #1 - Solana (SOLUSDT) 8-Hour Chart
Chartist: Sheldon
(For the chart screenshot, click here.)
Over the past three weeks, the price of SOL has declined by 20%, moving from around $24 at the end of April to its current price of $19.50.
During this period, SOL has also formed a "falling wedge" structure, typically considered a bullish indicator as prices usually break to the upside from it.
If SOL manages to break the top resistance line of the wedge, around $19.80 - $20.00, it could potentially rise to test the next resistance level between $21.30 - $22.00. But if the current Daily 200 Moving Average and the bottom support line of the wedge are breached, the next support level to watch is $17.50 - $18.00.
𝗣𝗿𝗶𝗺𝗲 𝗫𝗕𝗧
Sign up for a new Trading Account on Prime XBT!
Receive a deposit bonus of up to $7,000 with promo code: SheldonSniper
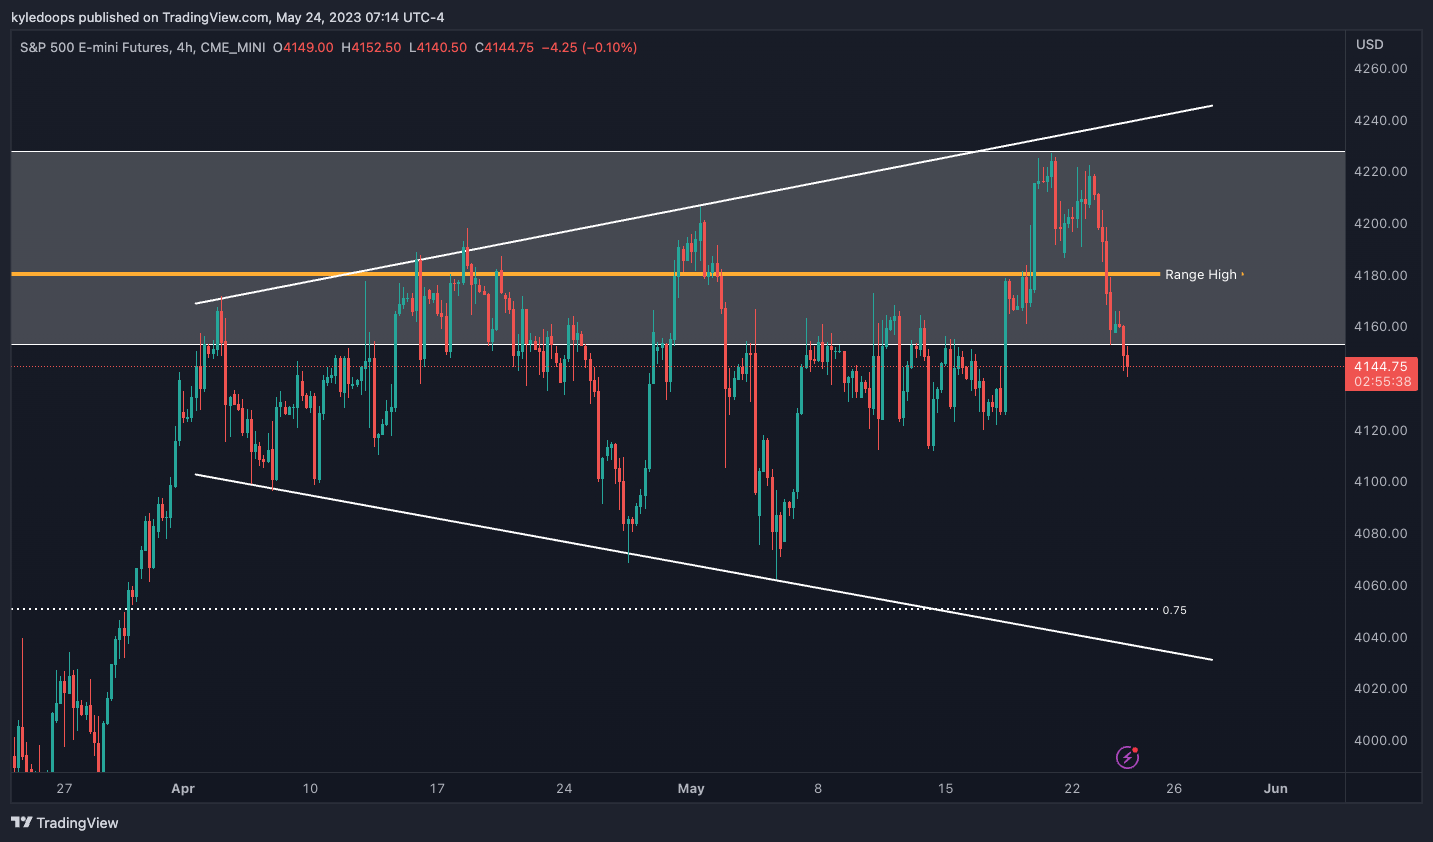
Chart #2 - S&P 500 Futures (ES1!) 4-Hour Chart
Chartist: Kyle
(For the chart screenshot, click here.)
The S&P 500 futures chart, represented by the ticker ES1!, recently encountered a key resistance level as detailed in previous editions of The Daily Candle.
The price has since experienced a rejection from the expanding megaphone pattern and has reentered the broader range.
The next price target is set between 4,030 and 4,040.
𝗣𝗿𝗶𝗺𝗲 𝗫𝗕𝗧
Sign up for a new Trading Account on Prime XBT!
Receive a deposit bonus of up to $7,000 with promo code: KyleDoops

Chart #3 - U.S. Dollar (DXY) 1-Day Chart
Chartist: Kyle

(For the chart screenshot, click here.)
The DXY (Dollar Index) has reached the long-term target of 103.39. At this stage, it's crucial to watch for either a continuation of this upward trend or the formation of a lower high.
If the DXY continues to rally, we can anticipate downward pressure on “risk-on” assets such as the stock market and Bitcoin. Achieving a level of 105.79 (labeled as T2 in my chart) would confirm the “W” formation pattern, likely leading to significantly higher targets.
Consider using the DXY in conjunction with Bitcoin and the S&P 500, especially when they are at key levels. This strategy can help you time your entries better. The confluence of these indicators can help enhance the precision of your trade setups.
Claim your Bitget sign-up bonuses here (details below).
Chart #4 - Bitcoin (BTCUSDT) 8-Hour Chart
Chartist: Sheldon

(For the chart screenshot, click here.)
Over the past two weeks, bitcoin has been trading within a narrow range, finding support at $26,650 and facing resistance at the range high of $27,500.
Yesterday, BTC once again reached the $27,500 high, and was rejected, before retracing to the range low of $26,650.
If BTC manages to break through the current range low and the Weekly 200 Moving Average at $26,300, it might visit the next major support level between $23,800 - $25,300. On the other hand, if the price breaks above the range high resistance of $27,500, the next significant resistance is between $28,800 - $30,500. That range aligns with the descending daily resistance line that has been in place since mid-April.
Claim your Bitget sign-up bonuses here (details below).
Chart #5 - Bitcoin Fear and Greed Index
The Bitcoin Fear and Greed Index is sitting at 50 today, Neutral.
The highest the index has been over the past seven days is 52, and the lowest is 48.

Banter’s Take
As the DXY soars and the stock market takes a downturn, Bitcoin might struggle to attract buyers. Given the ongoing narrative around the debt ceiling, many market participants are in “risk-off” mode. This trend is likely to continue until June 1st, when a decision regarding the raising of the debt ceiling is anticipated.
Stay safe my friends!
Go to our Crypto Banter Discord here where Sheldon and Kyle give updates on the charts and trades from The Daily Candle newsletter!
Competition Leaderboard
