

📈📉 This token could take a -40% hit soon! LDO looking bullish!
📈📉 This token could take a -40% hit soon! LDO looking bullish!

Bitget winner - 1163914631
Wondering what that 👆 is and how you can win? Then check out our daily shows on YouTube!
Are you using Bybit instead? Then look for the winning Bybit account below. But if you want to double your chances of winning, sign up today to both exchanges with the links found in the description of our YouTube videos!
Good luck to all!
Chart #1 - S&P 500 (SPX) 1-Day Chart
Chartist: Sheldon

(For the chart screenshot, click here.)
Over the last five weeks, the SPX has rallied from 3,800, up to where it is now, at 4,100 - 4,200 (resistance).
Two weeks ago, the SPX broke its weekly descending resistance line at 4,000. This line will now act as support if or when the SPX retraces back down to that level.
If the SPX gets rejected from where it currently sits, the next level of support is around 4,000, whereas a move higher from here would possibly take the SPX to the next level of resistance at 4,300.
Check our Crypto Banter Discord here for updates!
Follow me on Twitter for urgent updates on my trading progress!
Claim your Bitget sign-up bonuses here (details below).
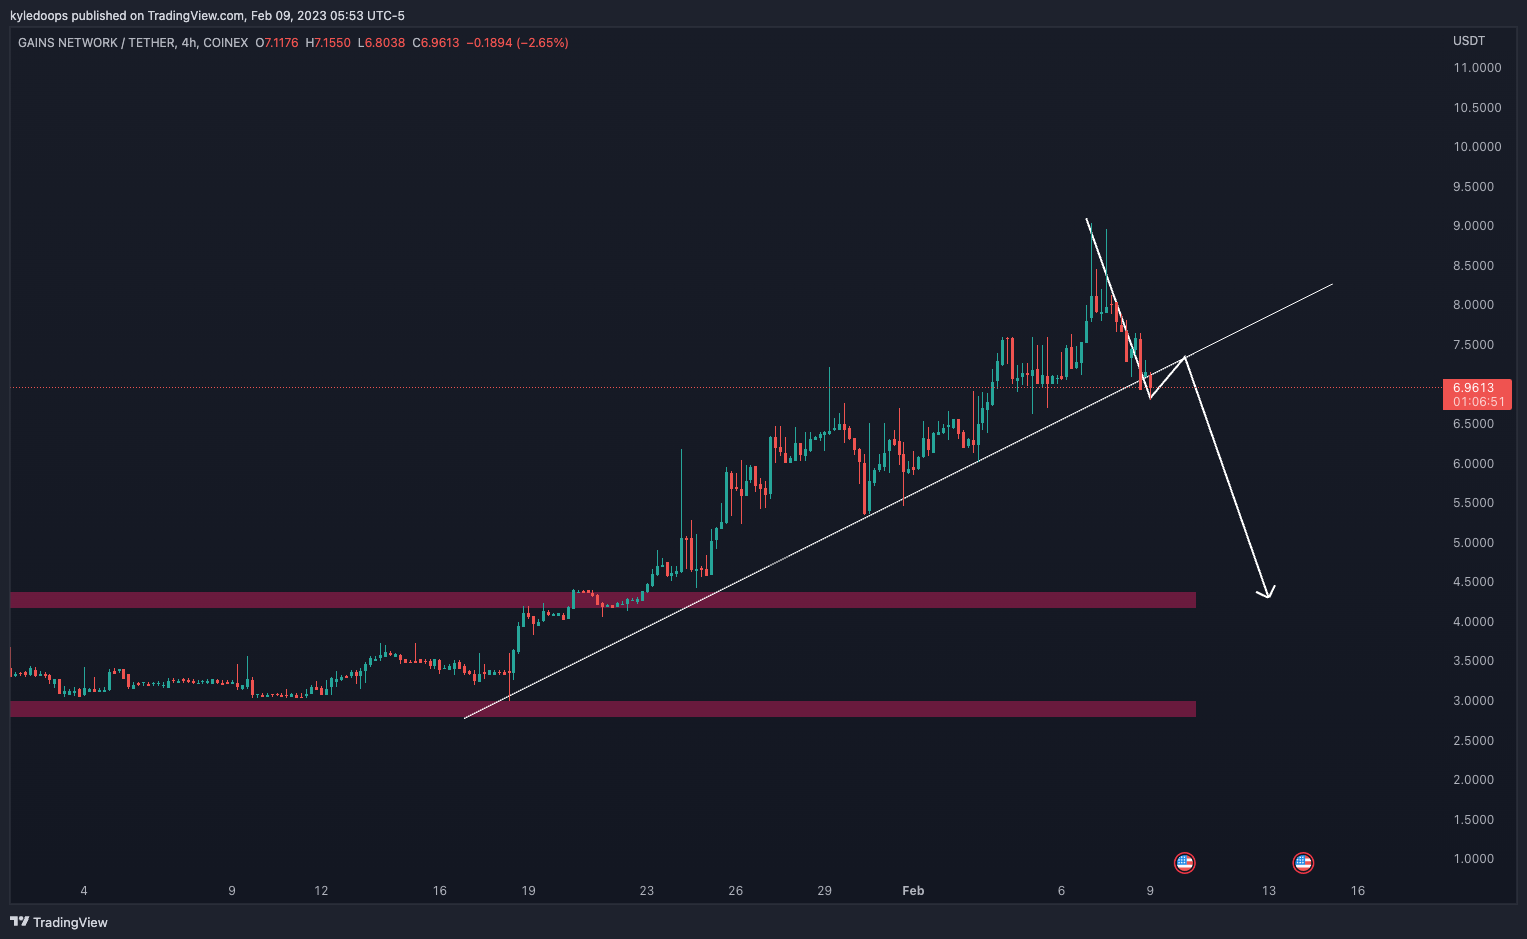
Chart #2 - Gains Network (GNSUSDT) 4-Hour Chart
Chartist: Kyle
(For the chart screenshot, click here.)
GNS needs to reclaim the trend line marked in the chart urgently!
Failure to do so in the next roughly 12 hours will more than likely confirm a bearish structure and lead to a major dump back down to $4.20. That is a massive -40% from the current level GNS finds itself at.
Check our Crypto Banter Discord here for updates!
Make sure to follow me on Twitter, where I will post updates on my trades as they unfold!
Claim your Bitget sign-up bonuses here (details below).
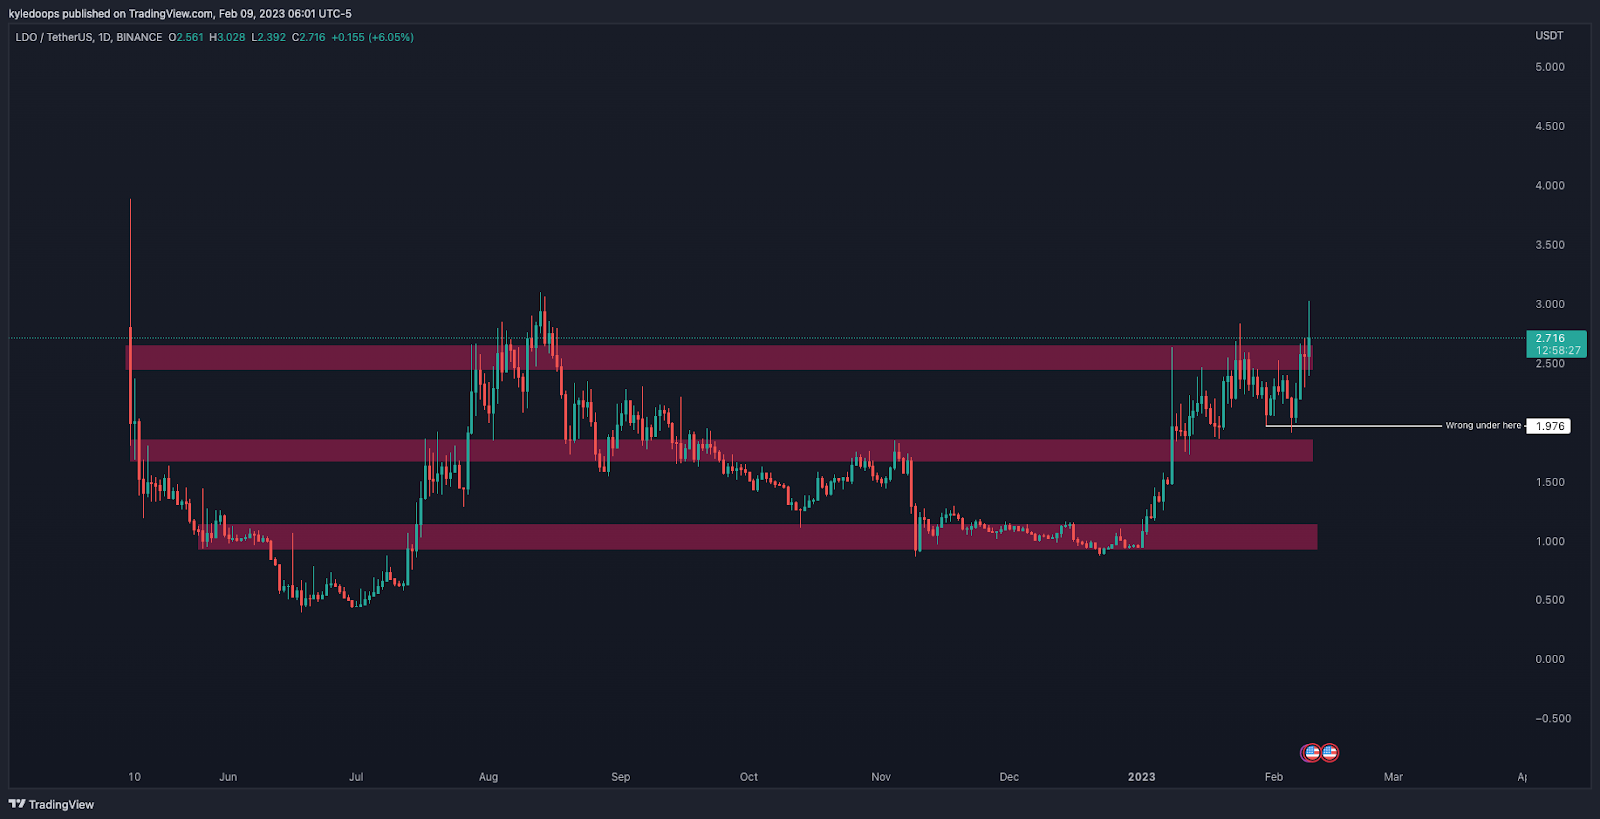
Chart #3 - Lido DAO (LDOUSDT) 1-Day Chart
Chartist: Kyle
(For the chart screenshot, click here.)
Things are seemingly looking bright for LDO.
If the price can close a few more daily candles at the current level or higher, LDO will likely enter into price discovery mode.
GMX and OP are two other tokens that recently experienced price discovery.
Check our Crypto Banter Discord here for updates!
Make sure to follow me on Twitter, where I will post updates on my trades as they unfold!
Claim your Bitget sign-up bonuses here (details below).
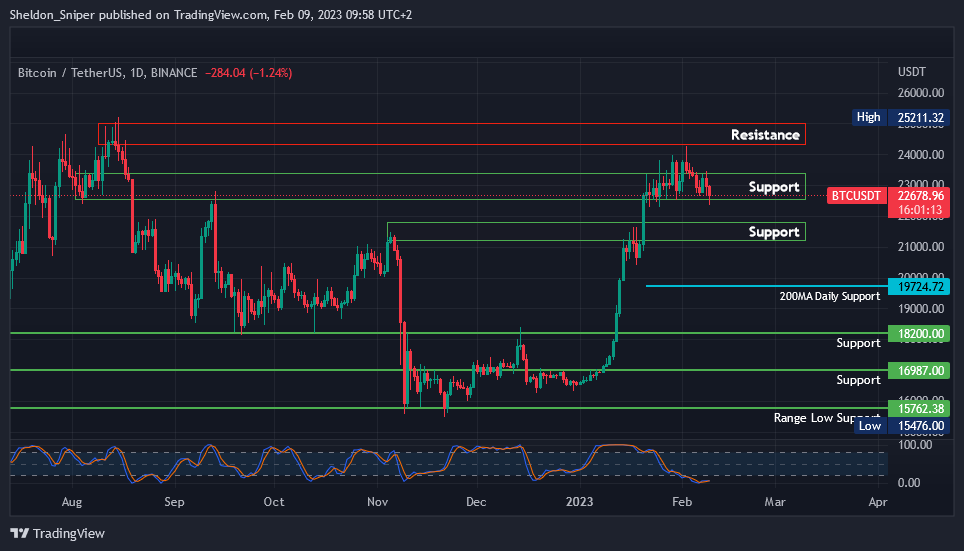
Chart #4 - Bitcoin (BTCUSDT) 1-Day Chart
Chartist: Sheldon
(For the chart screenshot, click here.)
Yesterday Bitcoin dropped from around $23,000 and retested the $22,400 area of support before slightly recovering back up to $22,675 this morning.
For three weeks, bitcoin has been trading between $22,400 and $23,500, leaving us to wonder whether it is consolidating in that range and getting ready to move higher or whether the whales are actually selling off.
If BTC breaks below $22,400, the next areas of support are at $21,300 - $21,800, and below that at $20,000 - $19,700 (200MA support on the daily). A rise from here would likely take the price to the next resistance between $24,450 - $25,000.
Check our Crypto Banter Discord here for updates!
Follow me on Twitter to get all the updates on my personal trading progress!
Claim your Bitget sign-up bonuses here (details below).
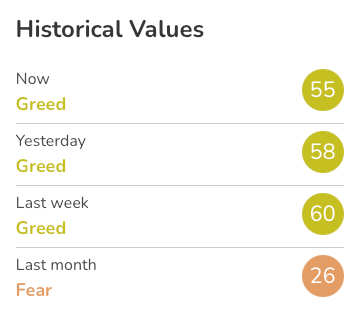
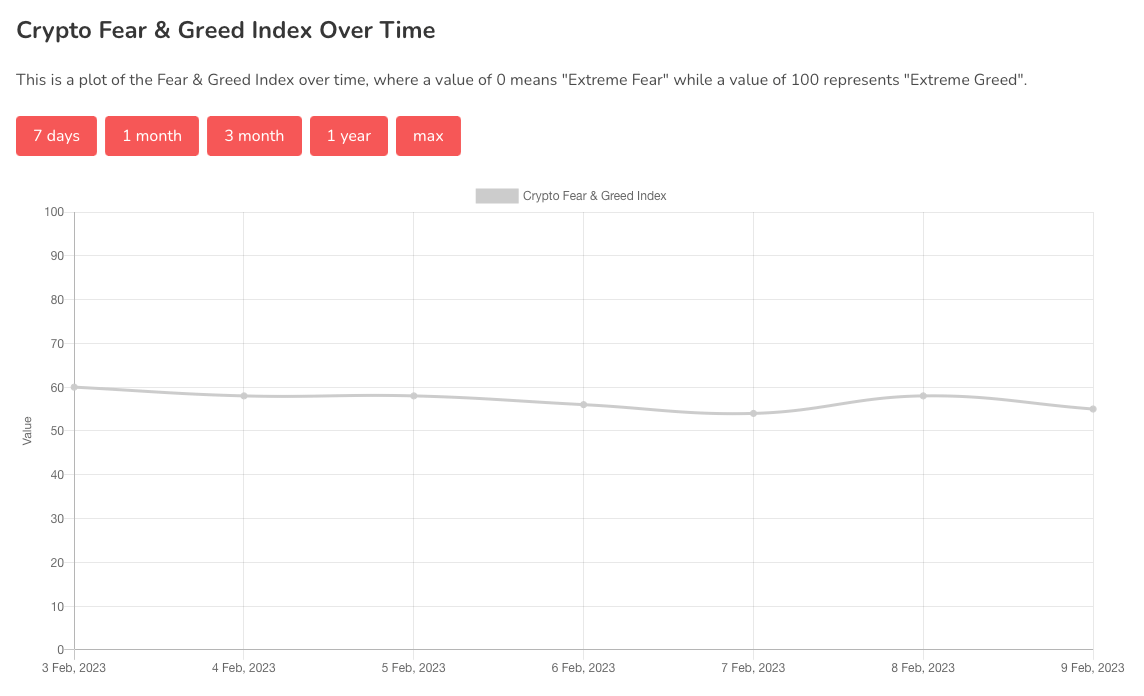
Chart #5 - Bitcoin Fear and Greed Index
The Bitcoin Fear and Greed Index is sitting at 55 today, indicating Greed.
The highest the index has been over the past seven days is 60, and the lowest is 54.

Overall Market Sentiment (Banter’s Take)
As long as bitcoin can hold above $21,500, the pullback is likely still a buying opportunity. Essentially, if the price can hold here and just move sideways, it will be bullish and mean another attempt at the highs should take place.
Stay safe my friends!
Bybit winner - 27503811