

📈📉 This Will Make Bitcoin Break Above $32,000!
📈📉 This Will Make Bitcoin Break Above $32,000!

Overview
Chart #1 - Ethereum (ETHUSDT) Daily Chart
Chart #2 - Bitcoin (BTCUSD) Hourly Chart
Chart #3 - Crypto Total Market Cap (TOTAL) 3-Day Chart
Chart #4 - Bitcoin Dominance (BTC.D) Daily Chart
Chart #5 - Fear and Greed Index

Chart #1 - Ethereum (ETHUSDT) Daily Chart
Chartist: Sheldon
(For the chart screenshot, click here.)
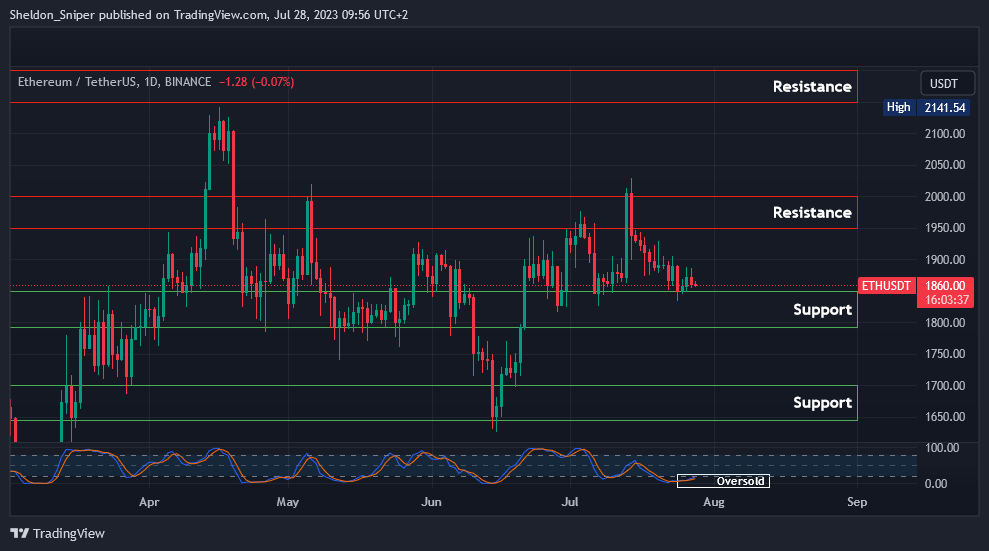
The price of ETH has once again found support at around $1,850, a support area that has held for over the last four weeks.
BTC is currently looking very weak, and if there is a retracement, it could drag the entire market down with it, including ETH. However, ETH is oversold on the daily timeframe, and once the price of BTC stabilizes, there should be a positive trend reversal for ETH.
Areas to watch are the current $1,800 - $1,850 range. If this is lost, the next major area of support is at $1,650 - $1,700. On the upside, the $1,950 - $2,000 range is still currently acting as a resistance area.
Sign-up and trade on Bybit today.
Exclusive $30,000 deposit rewards and bonuses up for grabs!
Chart #2 - Bitcoin (BTCUSD) Hourly Chart
Chartist: Kyle
(For the chart screenshot, click here.)
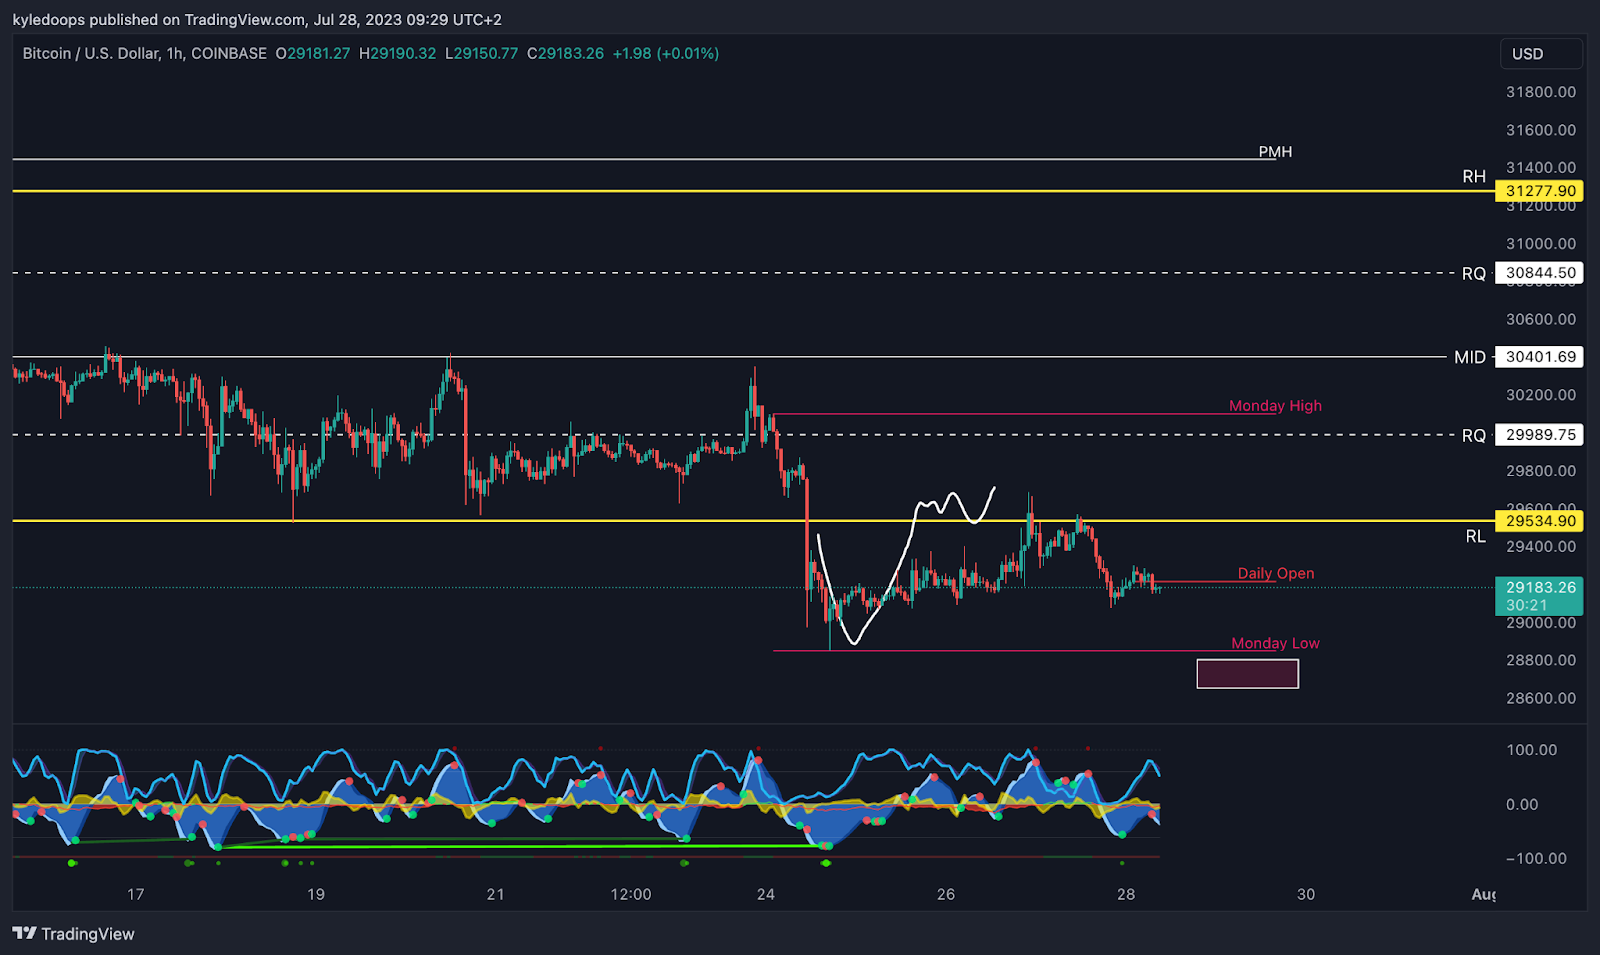
Bitcoin is taking its time to get back into the range, and is starting to gain acceptance below that $29,534 range low.
This means a possible sweep below Monday's low is still likely. In the short term, this means the price is likely to tag $28,600.
If the price breaks back into the range - in other words, reclaims $29,534 - then it would be bullish. However, until then, the risk remains to the downside.
𝗣𝗿𝗶𝗺𝗲 𝗫𝗕𝗧
Sign up for a new Trading Account on Prime XBT!
Receive a deposit bonus of up to $7,000 with promo code: KyleDoops

Sign up for a new Trading Account on Prime XBT!
Receive a deposit bonus of up to $7,000 with promo code: SheldonSniper
Chart #3 - Crypto Total Market Cap (TOTAL) 3-Day Chart
Chartist: Kyle
(For the chart screenshot, click here.)
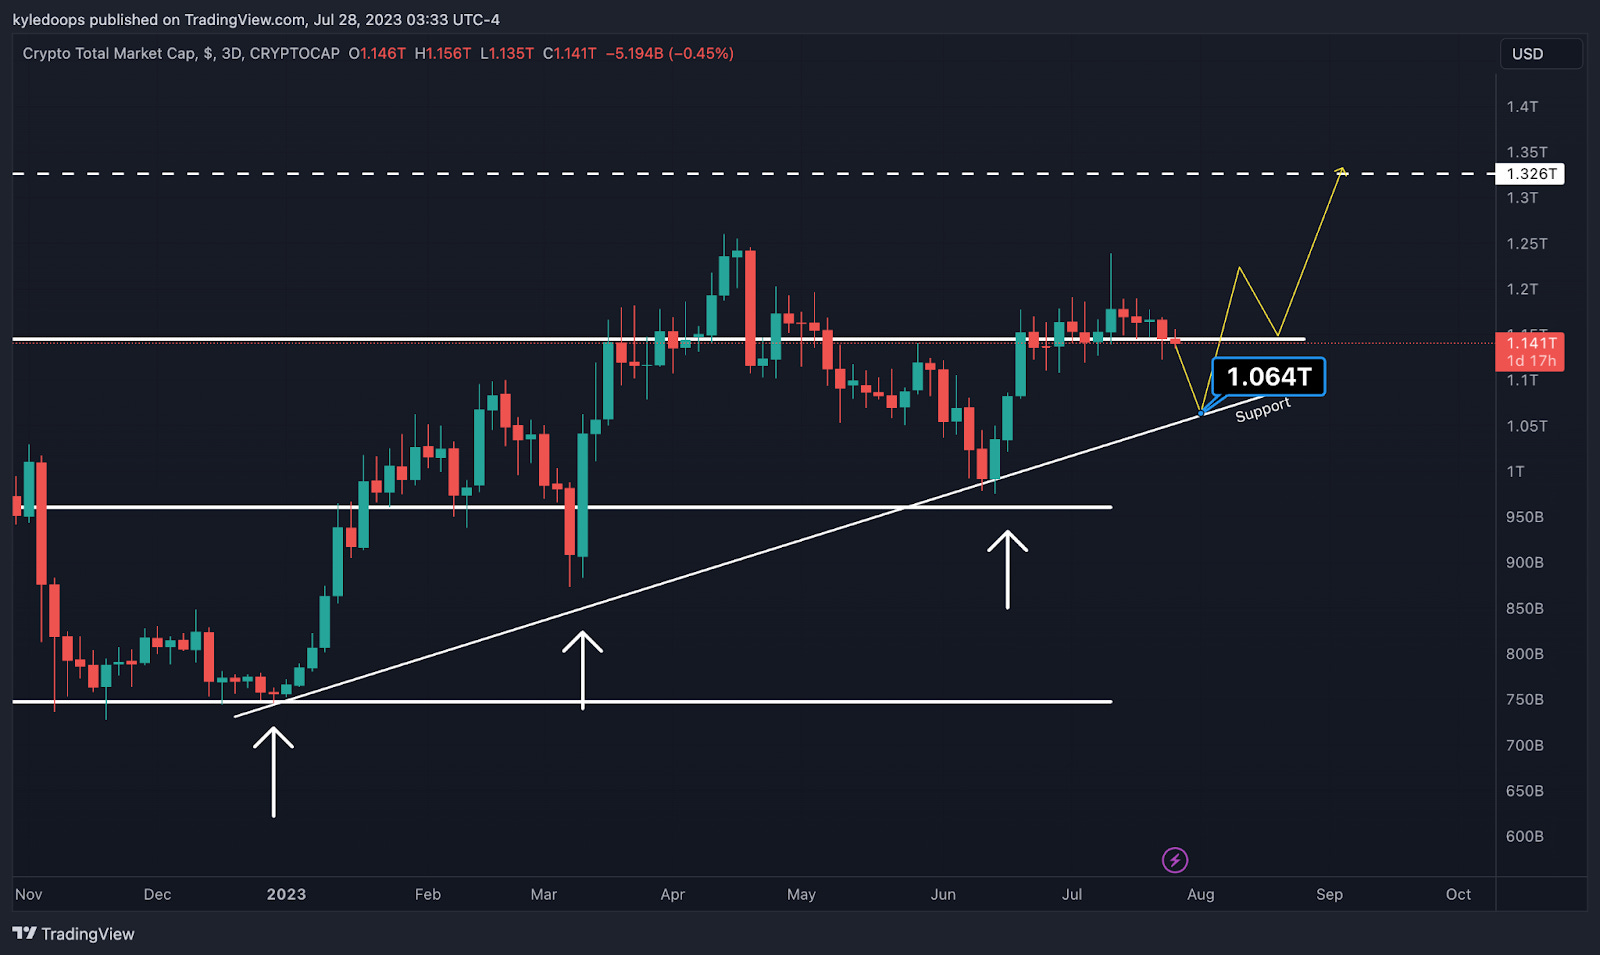
The TOTAL is losing its range high at $1.14 trillion, which means the next support is at $1.06 trillion.
If the price bounces from that level and reclaims the $1.14 trillion mark, then we would be looking for the total market cap to move up towards $1.326 trillion.
This would likely result in Bitcoin breaking above the very key resistance level of $32,000.
Claim your Bitget sign-up bonuses here (details below).
Chart #4 - Bitcoin Dominance (BTC.D) Daily Chart
Chartist: Sheldon
(For the chart screenshot, click here.)
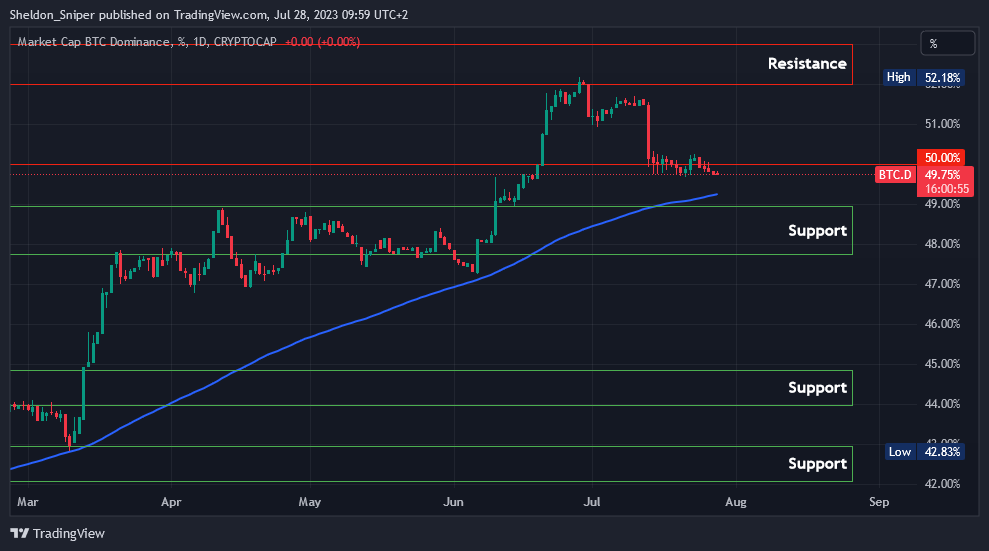
BTC.D was in an uptrend for most of 2023, before it found resistance at the beginning of July, around the 52% mark. Over the last four weeks, the dominance has slightly retraced as cash left BTC and flowed into the altcoins.
Currently, BTC.D is around 50%, and I expect that at some stage there will be a further retracement to test the 48%-49% area. This was acting as resistance for the last two years before being broken last month.
The 100 Moving Average on the daily (blue line) has been acting as support over the last seven months, and I expect it to once again serve this role if BTC.D retraces lower to that area. A move lower in BTC.D will be very bullish for the alts, as cash leaves BTC and flows into them.
Claim your Bitget sign-up bonuses here (details below).
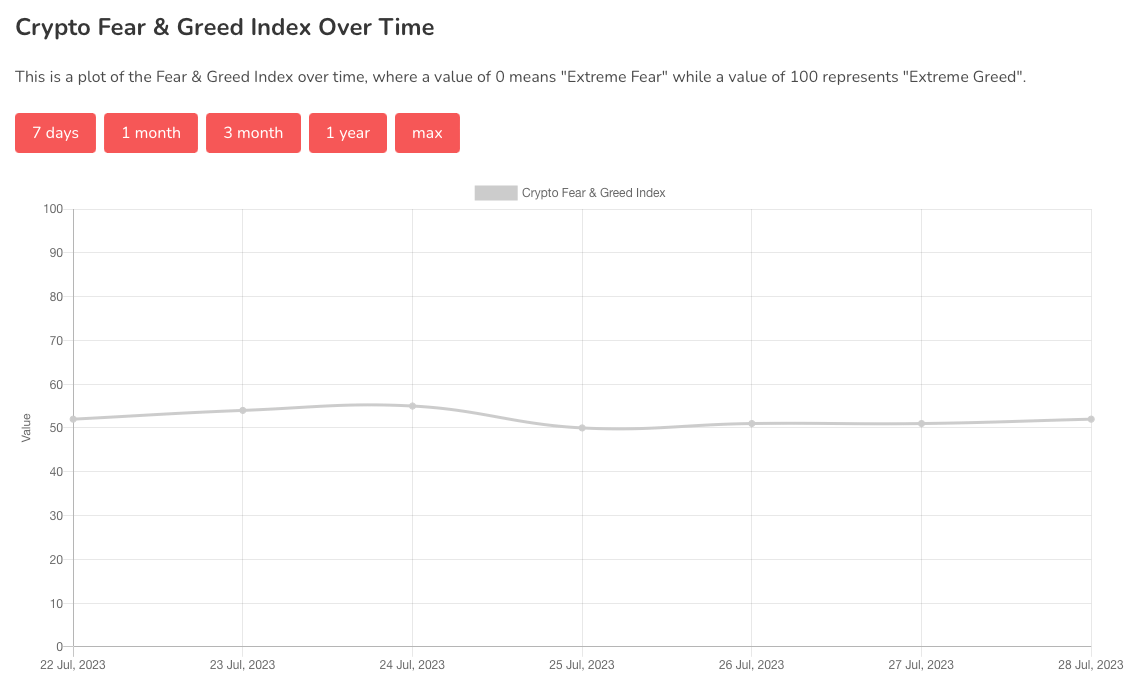
Chart #5 - Fear and Greed Index
The Fear and Greed Index is sitting at 52 today, Neutral.
The highest the index has been over the past seven days is 55, and the lowest is 50.
Banter’s Take
The market is pulling back in the short term. However, on a high timeframe, things still look positive for bulls. The $27,000 - $28,500 level is absolutely key for bulls to defend. If that level is lost, the market will turn very bearish, very quickly.
But for now, considering the medium timeframe, the bulls have the edge.
Stay safe my friends!
Go to our Crypto Banter Discord here where Sheldon and Kyle give updates on the charts and trades from The Daily Candle newsletter!